
Confidentiality
This case study omits or anonymity certain details (data, copy, and internal documentation) to respect client confidentiality. It is shared here privately for portfolio and discussion purposes only.
Full Case Study: Please contact me at gopi@gtrdesign.ca to view this link. This includes finished screens.
Product
Nova (TrueSpark), an enterprise web app that speeds up residential appraisal by automating data import, market analysis, and adjustments between form‑filler tools and final Uniform Residential Appraisal Report (URAR) reports.
Spark and Synapse started as helper tools bolted onto legacy form‑fillers; the first step was to understand their combined workflow and pain points.
Users
Professional appraisers (often 50+, but is rapidly transitioning to a younger demographic), using older laptops and legacy tools.
Problem
Existing tools are slow, cluttered, and error‑prone; previous tools from client were fragmented and not designed as one product.
Role
Senior UX Designer responsible for interaction design and IA across sessions, data import, Market Trends, Grid, and Adjustments, in collaboration with product, front‑end, and data science.
Goal
Reduce time and errors in building defensible appraisal reports while preserving URAR/1004 compliance and appraisers’ control.
Section A – Designing the appraisal workflow
Reframing Spark and Synapse into a single Nova workflow that matches how appraisers actually think about sessions, data, and reports.
Spark and Synapse started as helper tools bolted onto legacy form‑fillers; the first step was to understand their combined workflow and pain points.
From helper tools to Nova
Spark and Synapse started as helper tools bolted onto legacy form‑fillers; the first step was to understand their combined workflow and pain points.
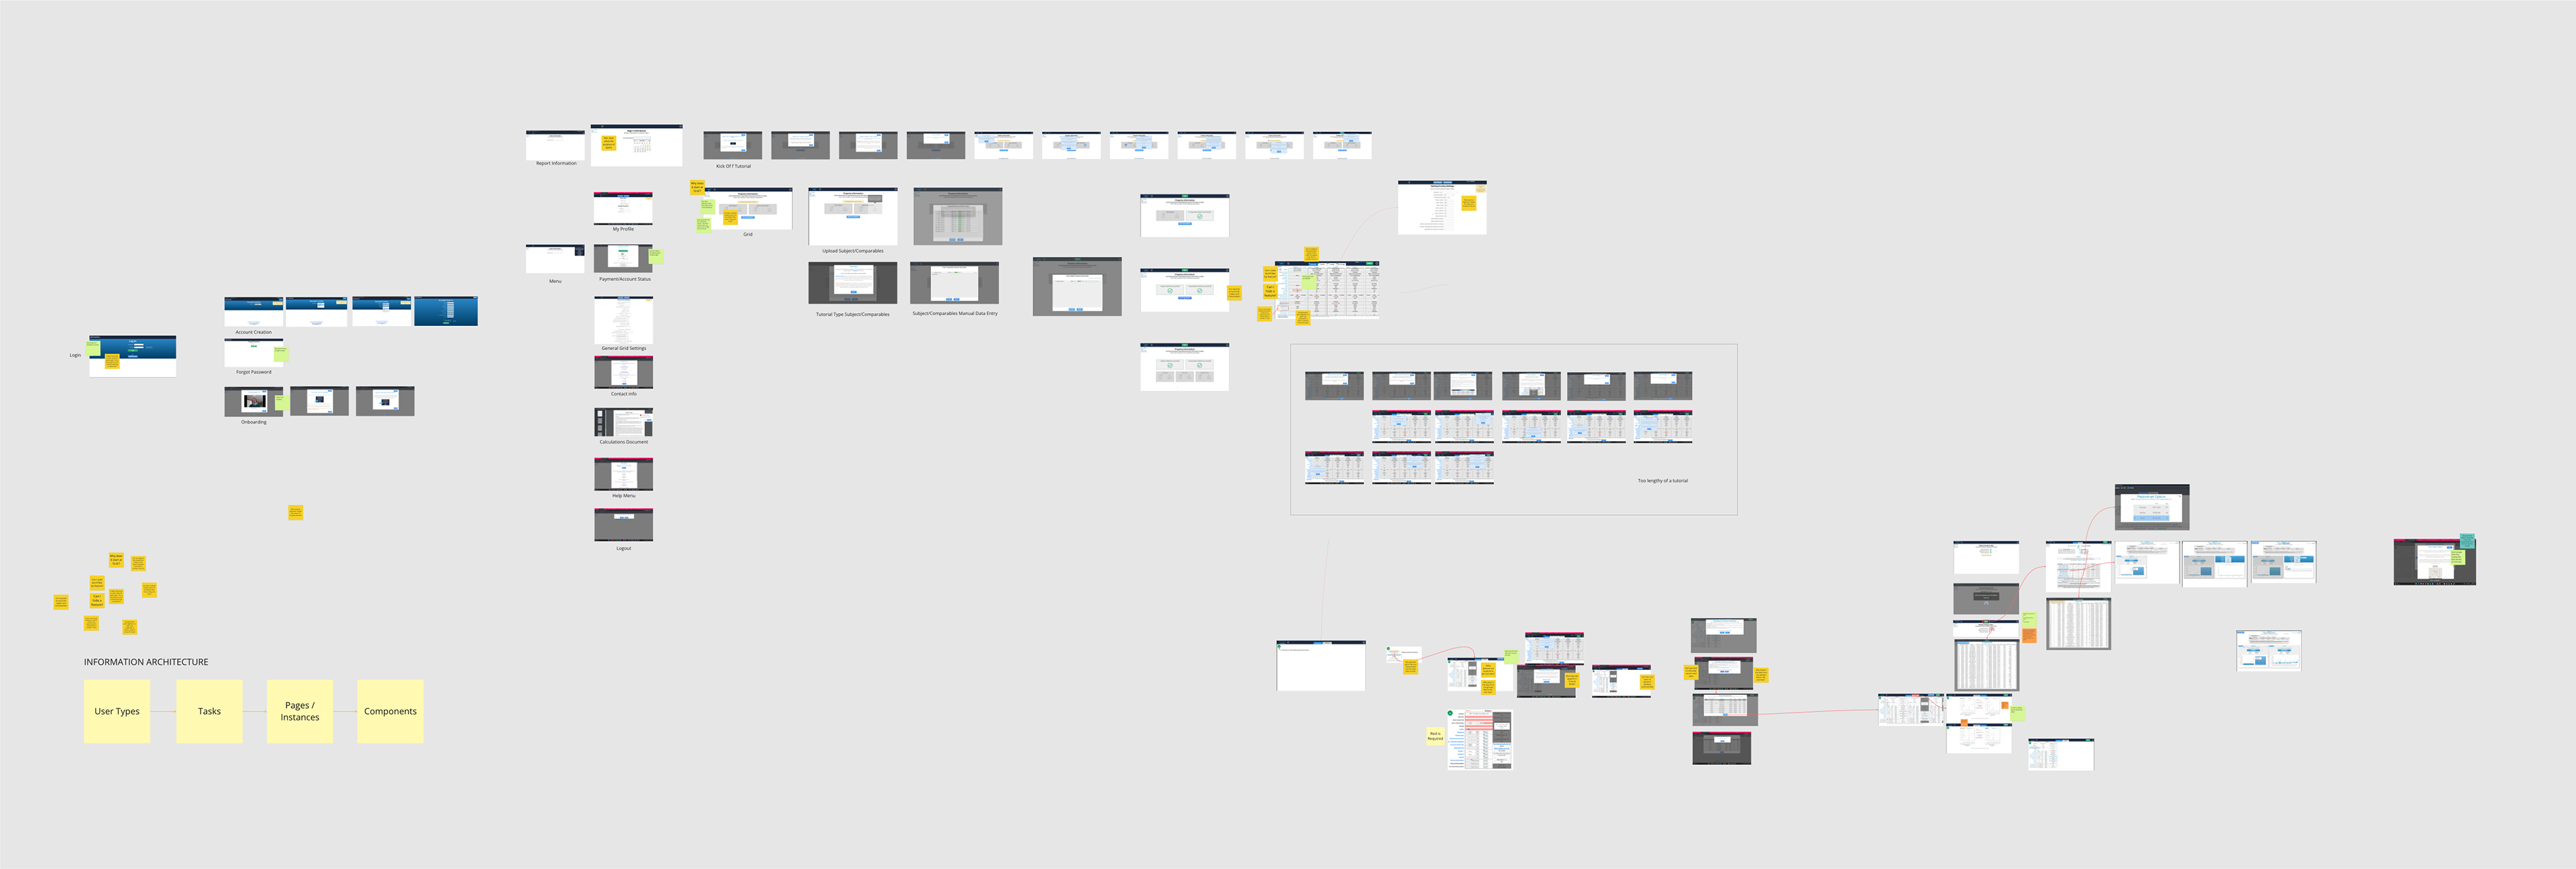
Full Map of the existing production app of Spark as current appraisers experienced them.
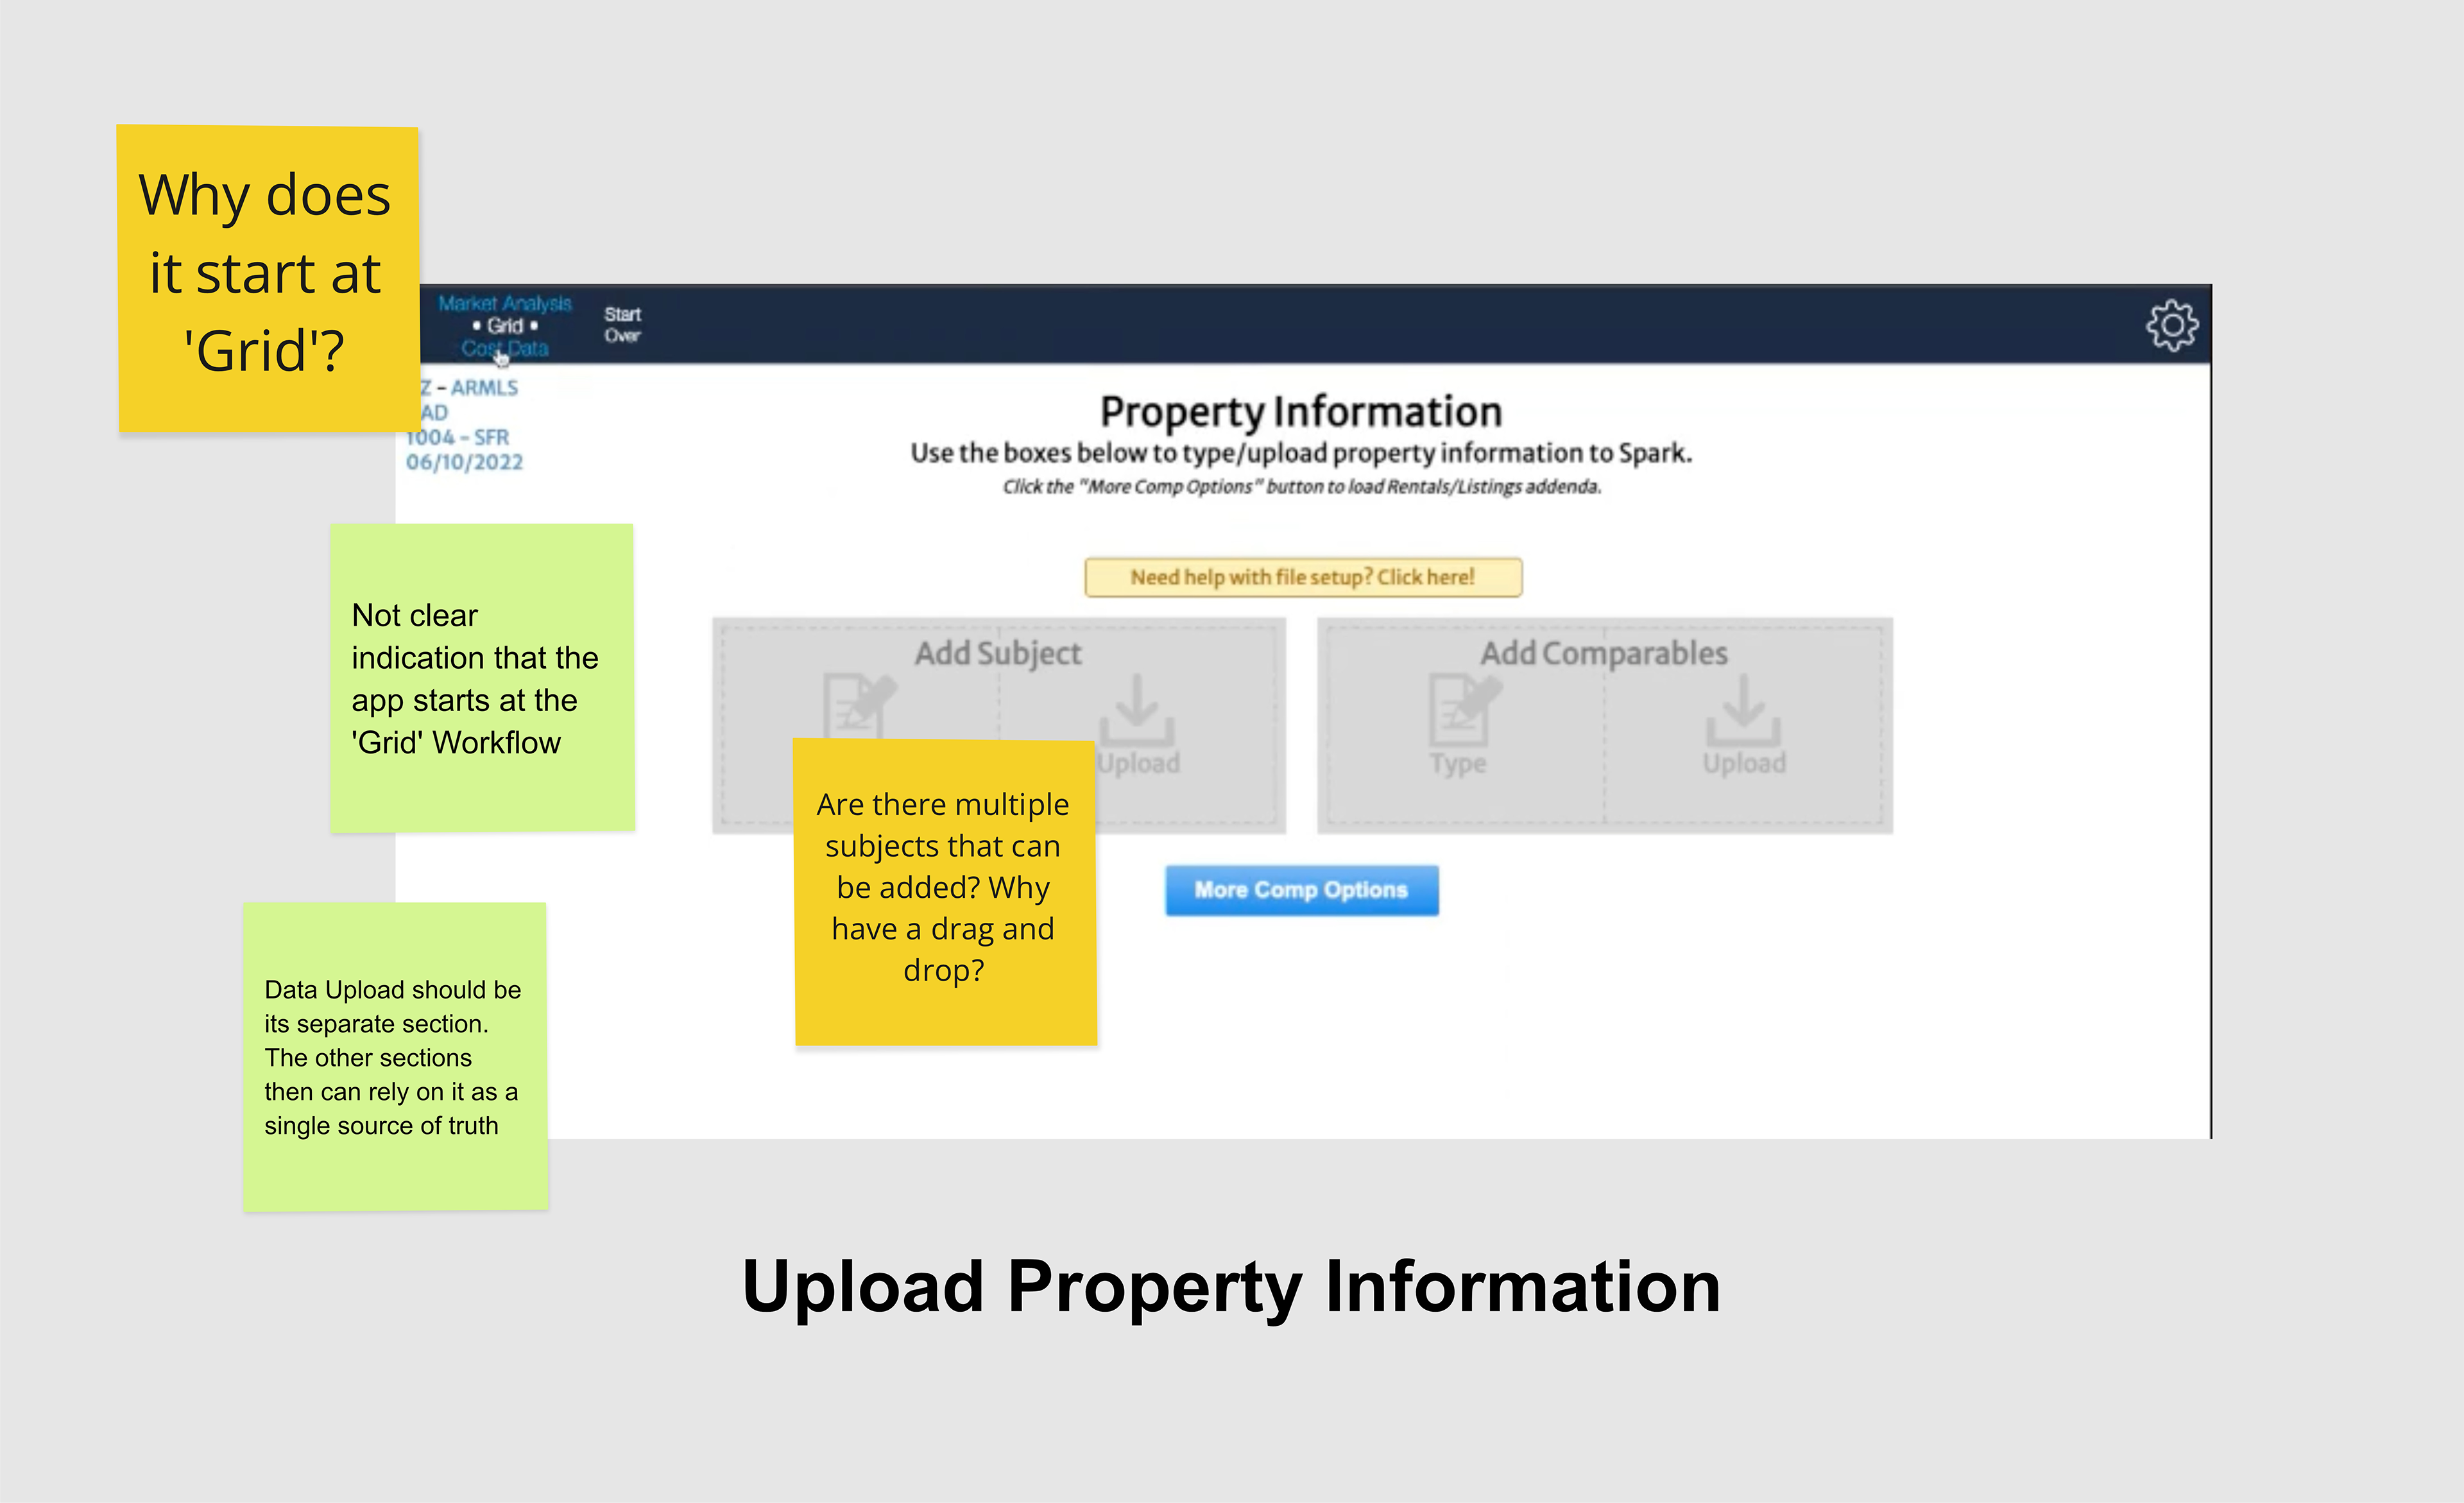
Left: Upon logging in, the user is prompted to upload property information. The subject is a single property that would be analyzed for the purpose of appraising its value.
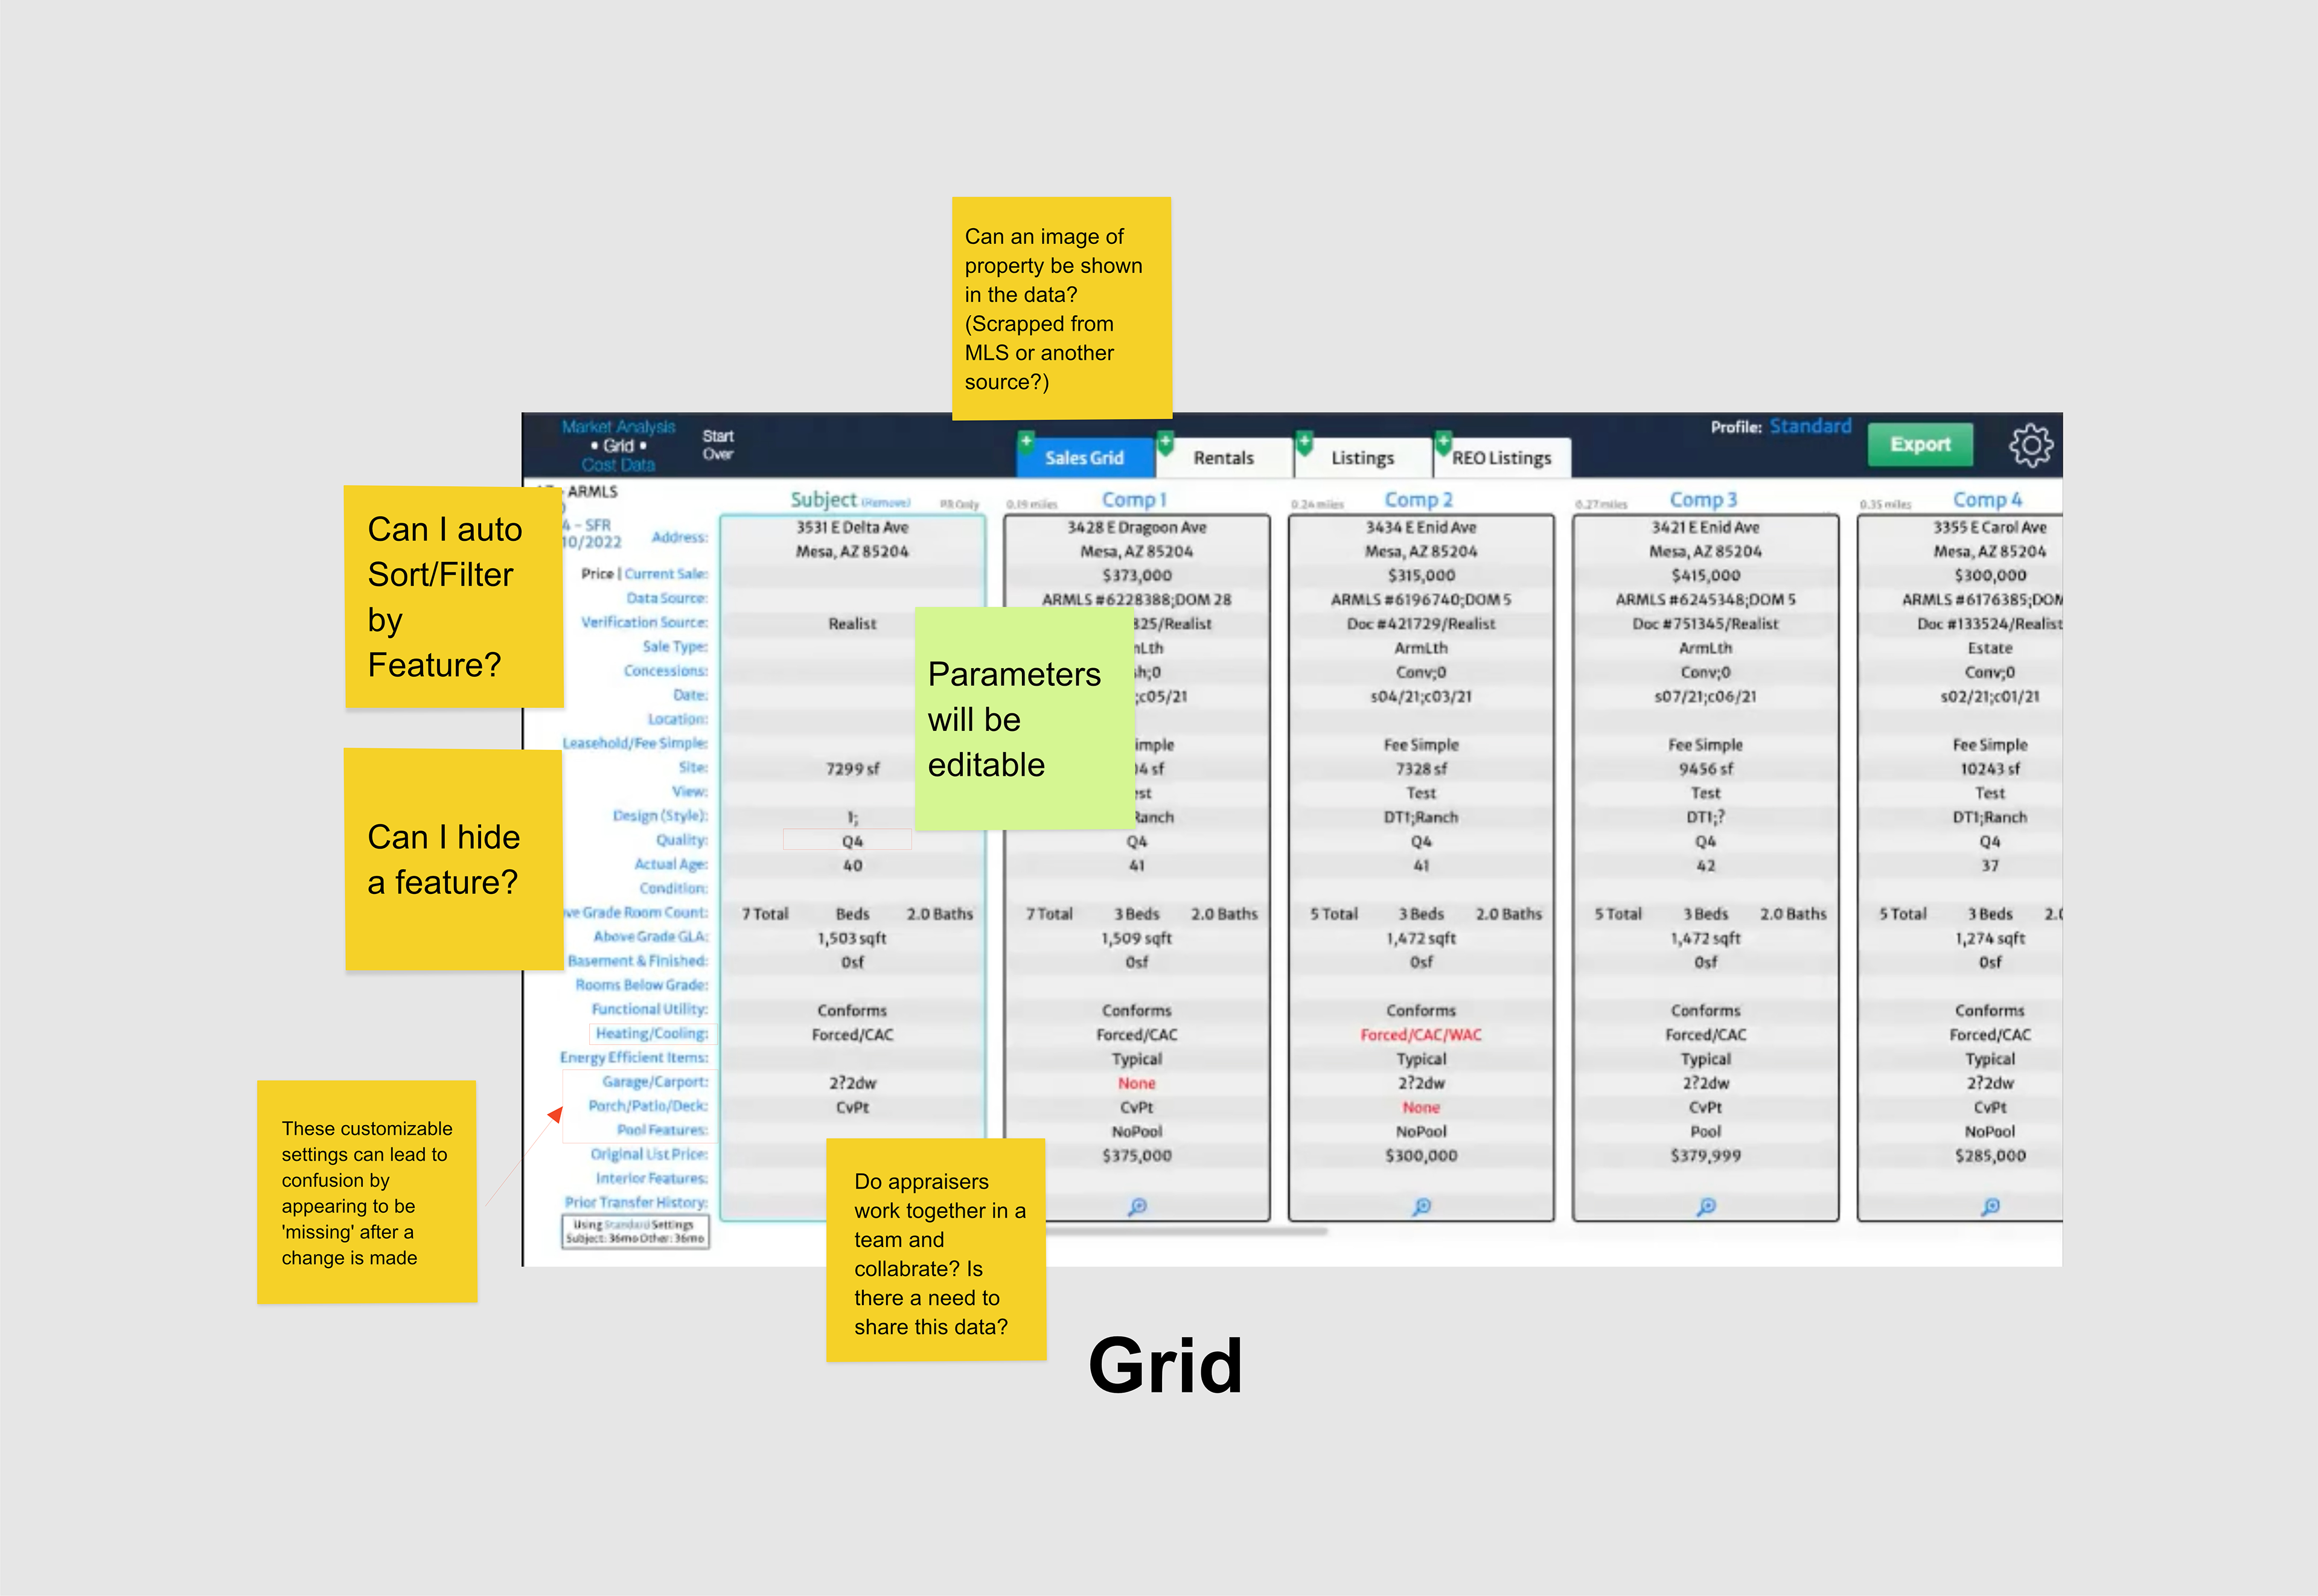
Right: The Comparative Grid, where the subject property is compared to similar properties in the neighbourhood.
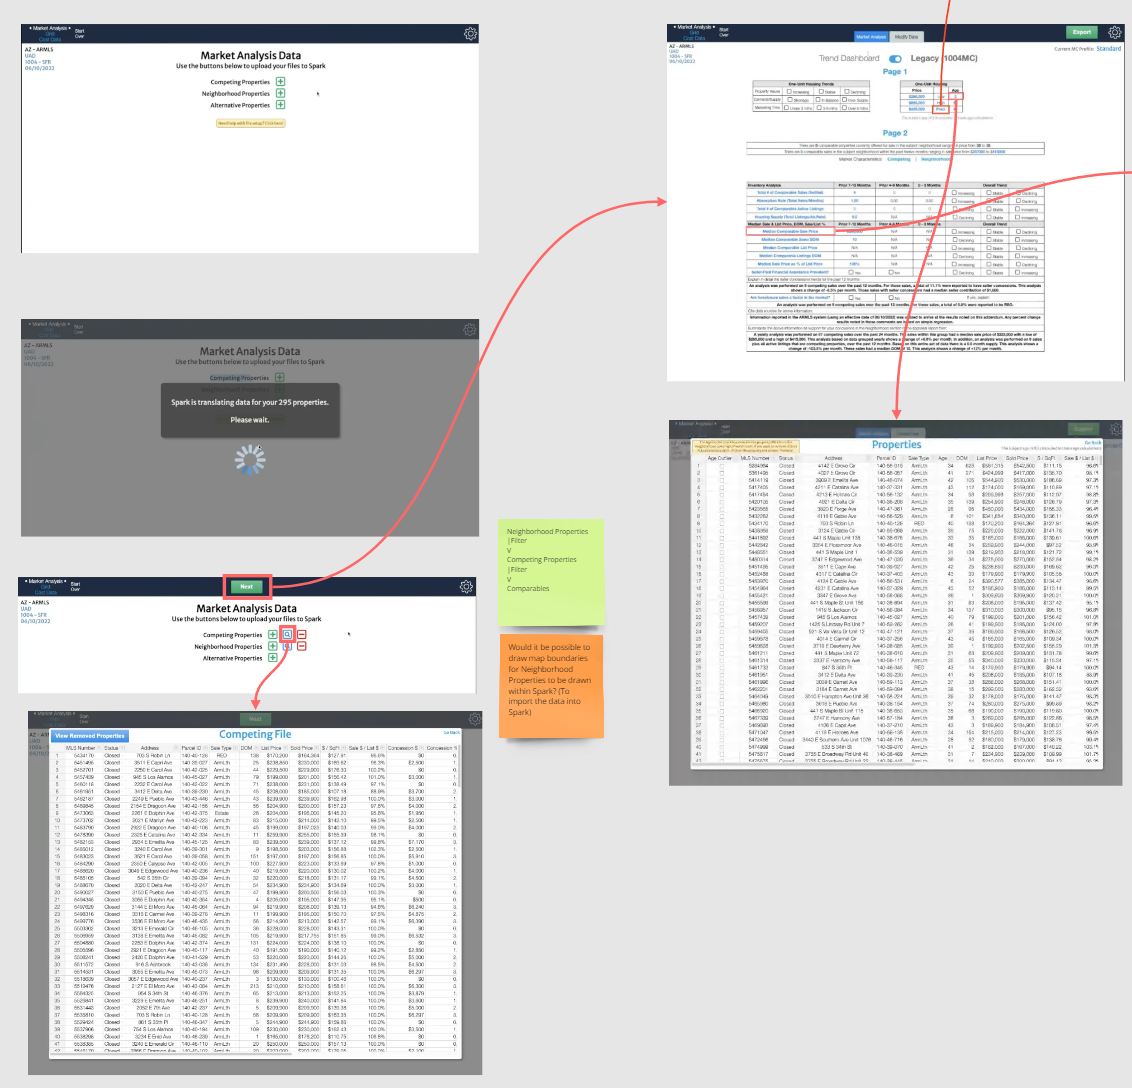
Zoomed-in view of the Market Analysis area, where an entire neighbourhood would be analyzed to describe where the general market is trending. This data is then calculated to help prove the accuracy of the appraisal. Here, there are many separate steps and screens appraisers had to navigate to analyze trends and cost data.
Function sitemap / Nova structure
With testing the production app and the screenshot map as reference, we broke down the app into an exhaustive map of all functions that can be done.
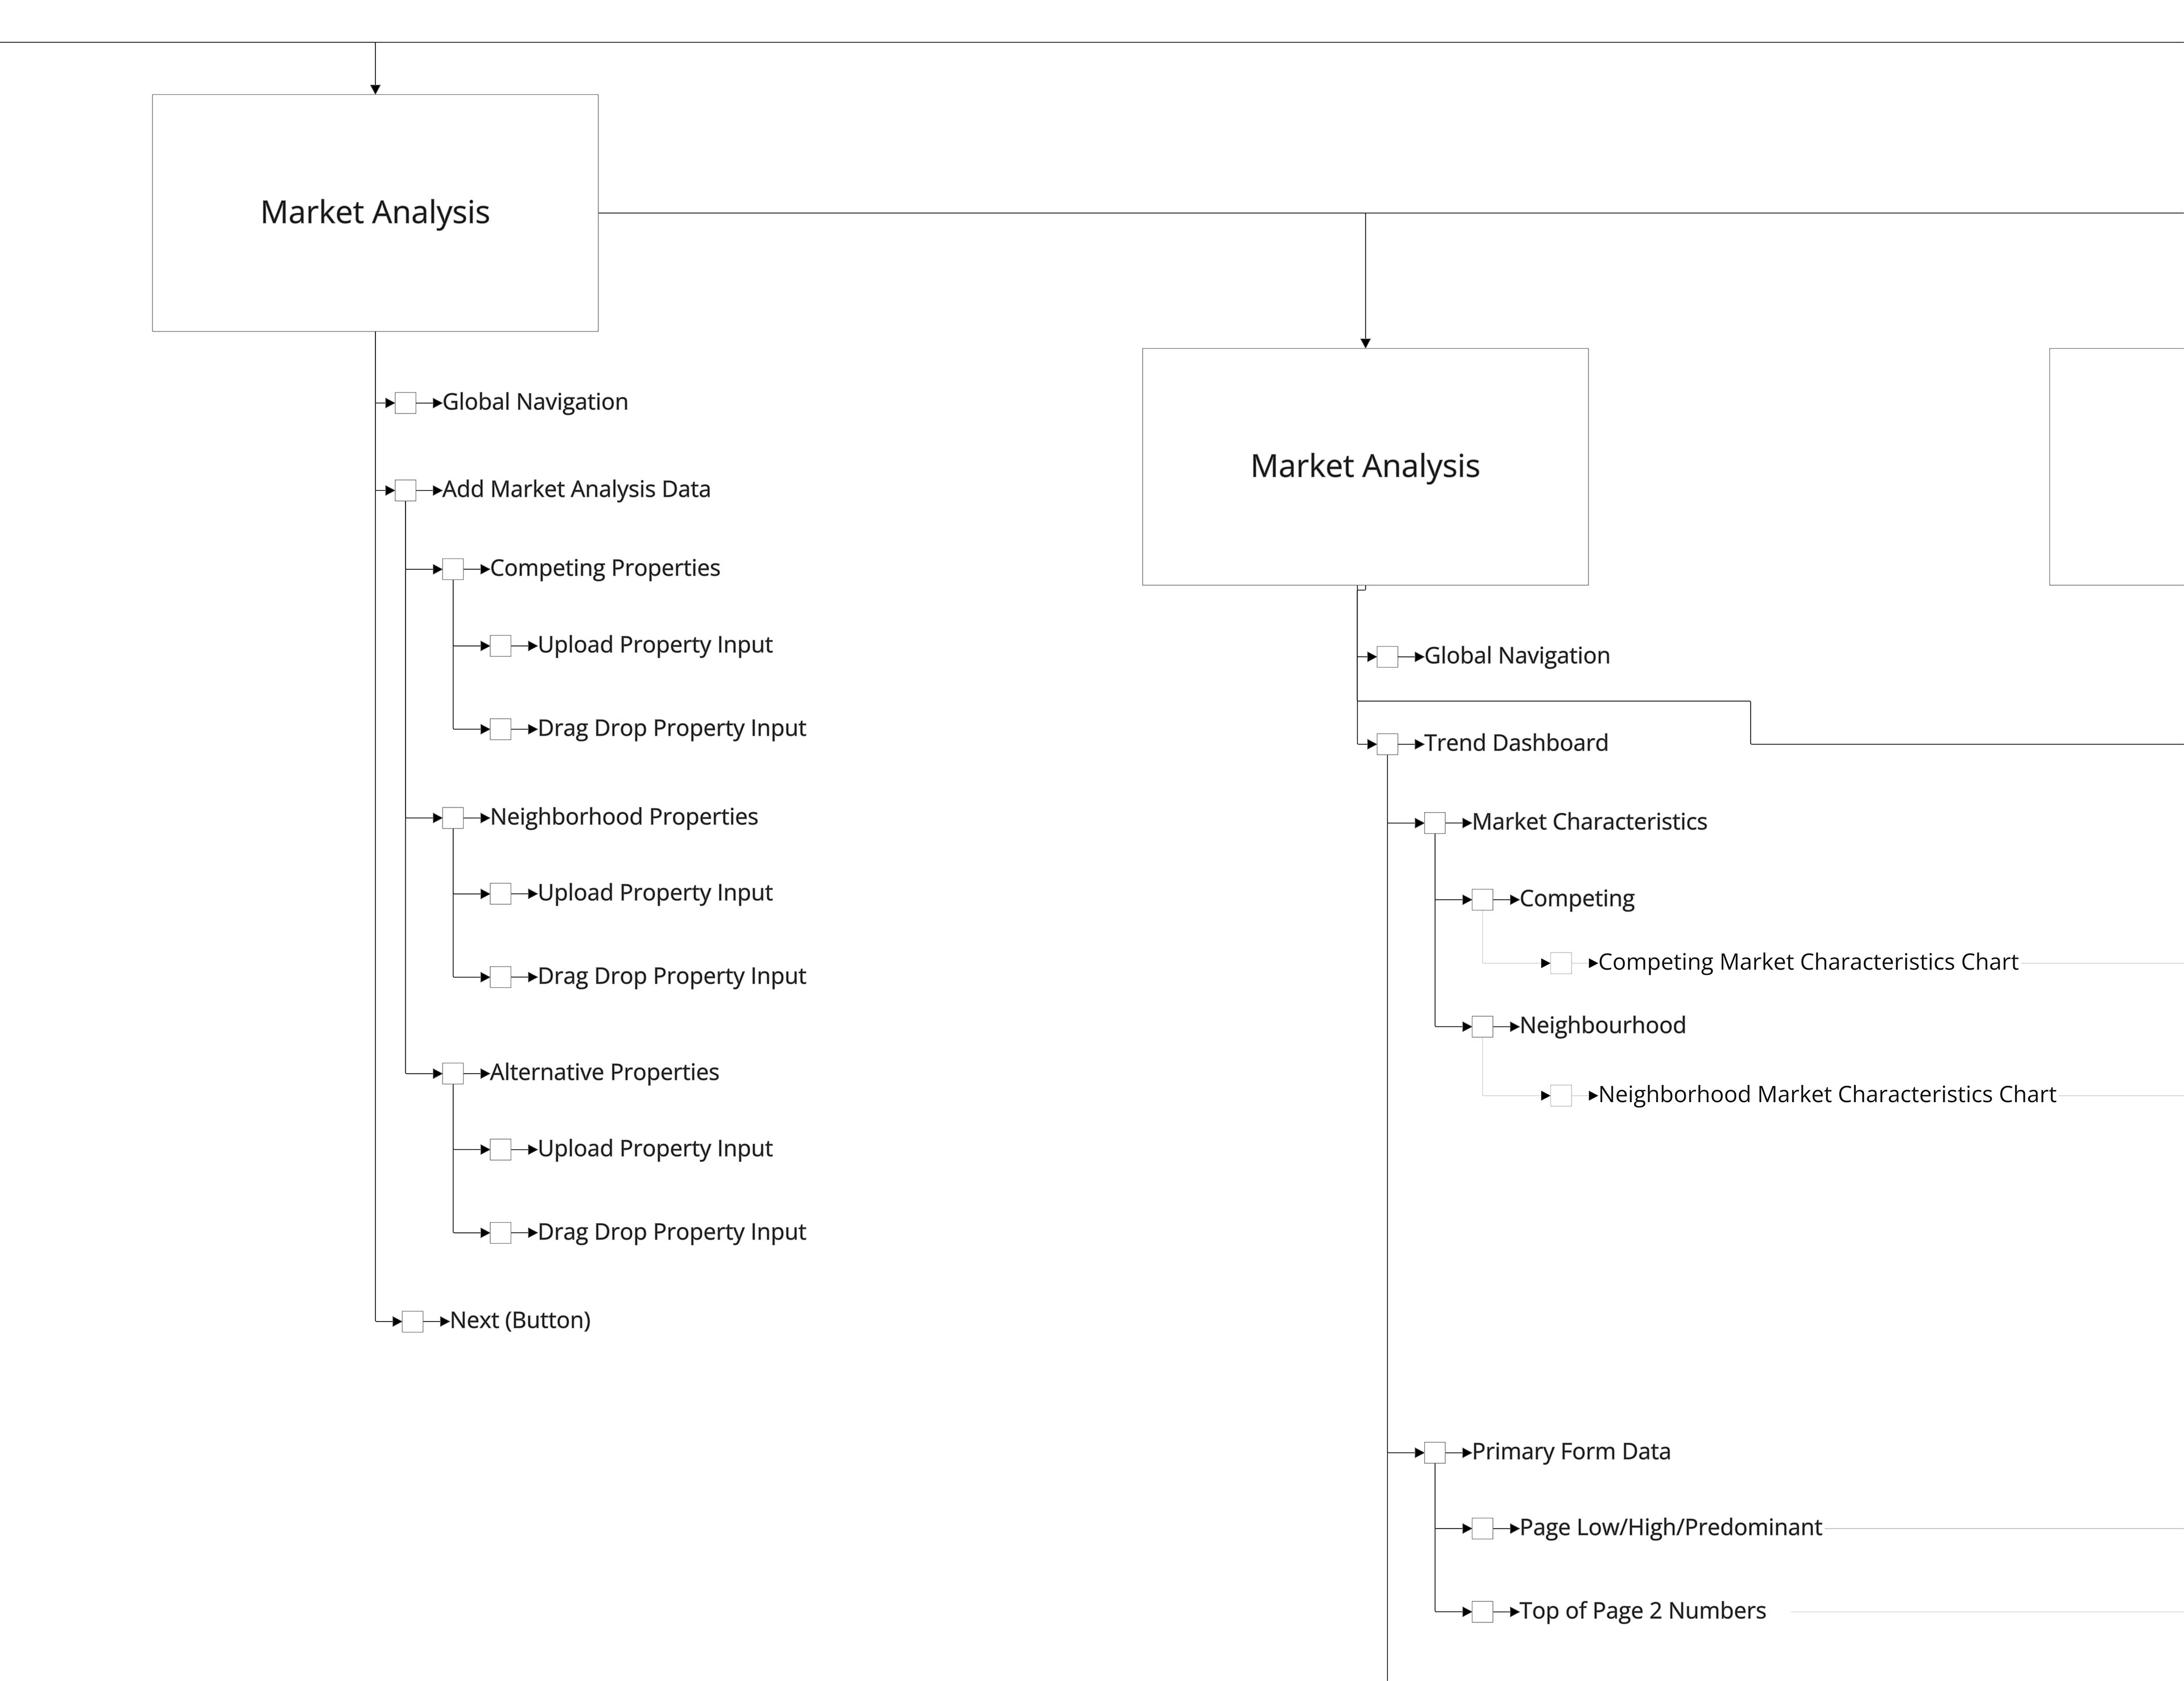
Snippet of the Market Analysis, with functionality that can be done for each page.
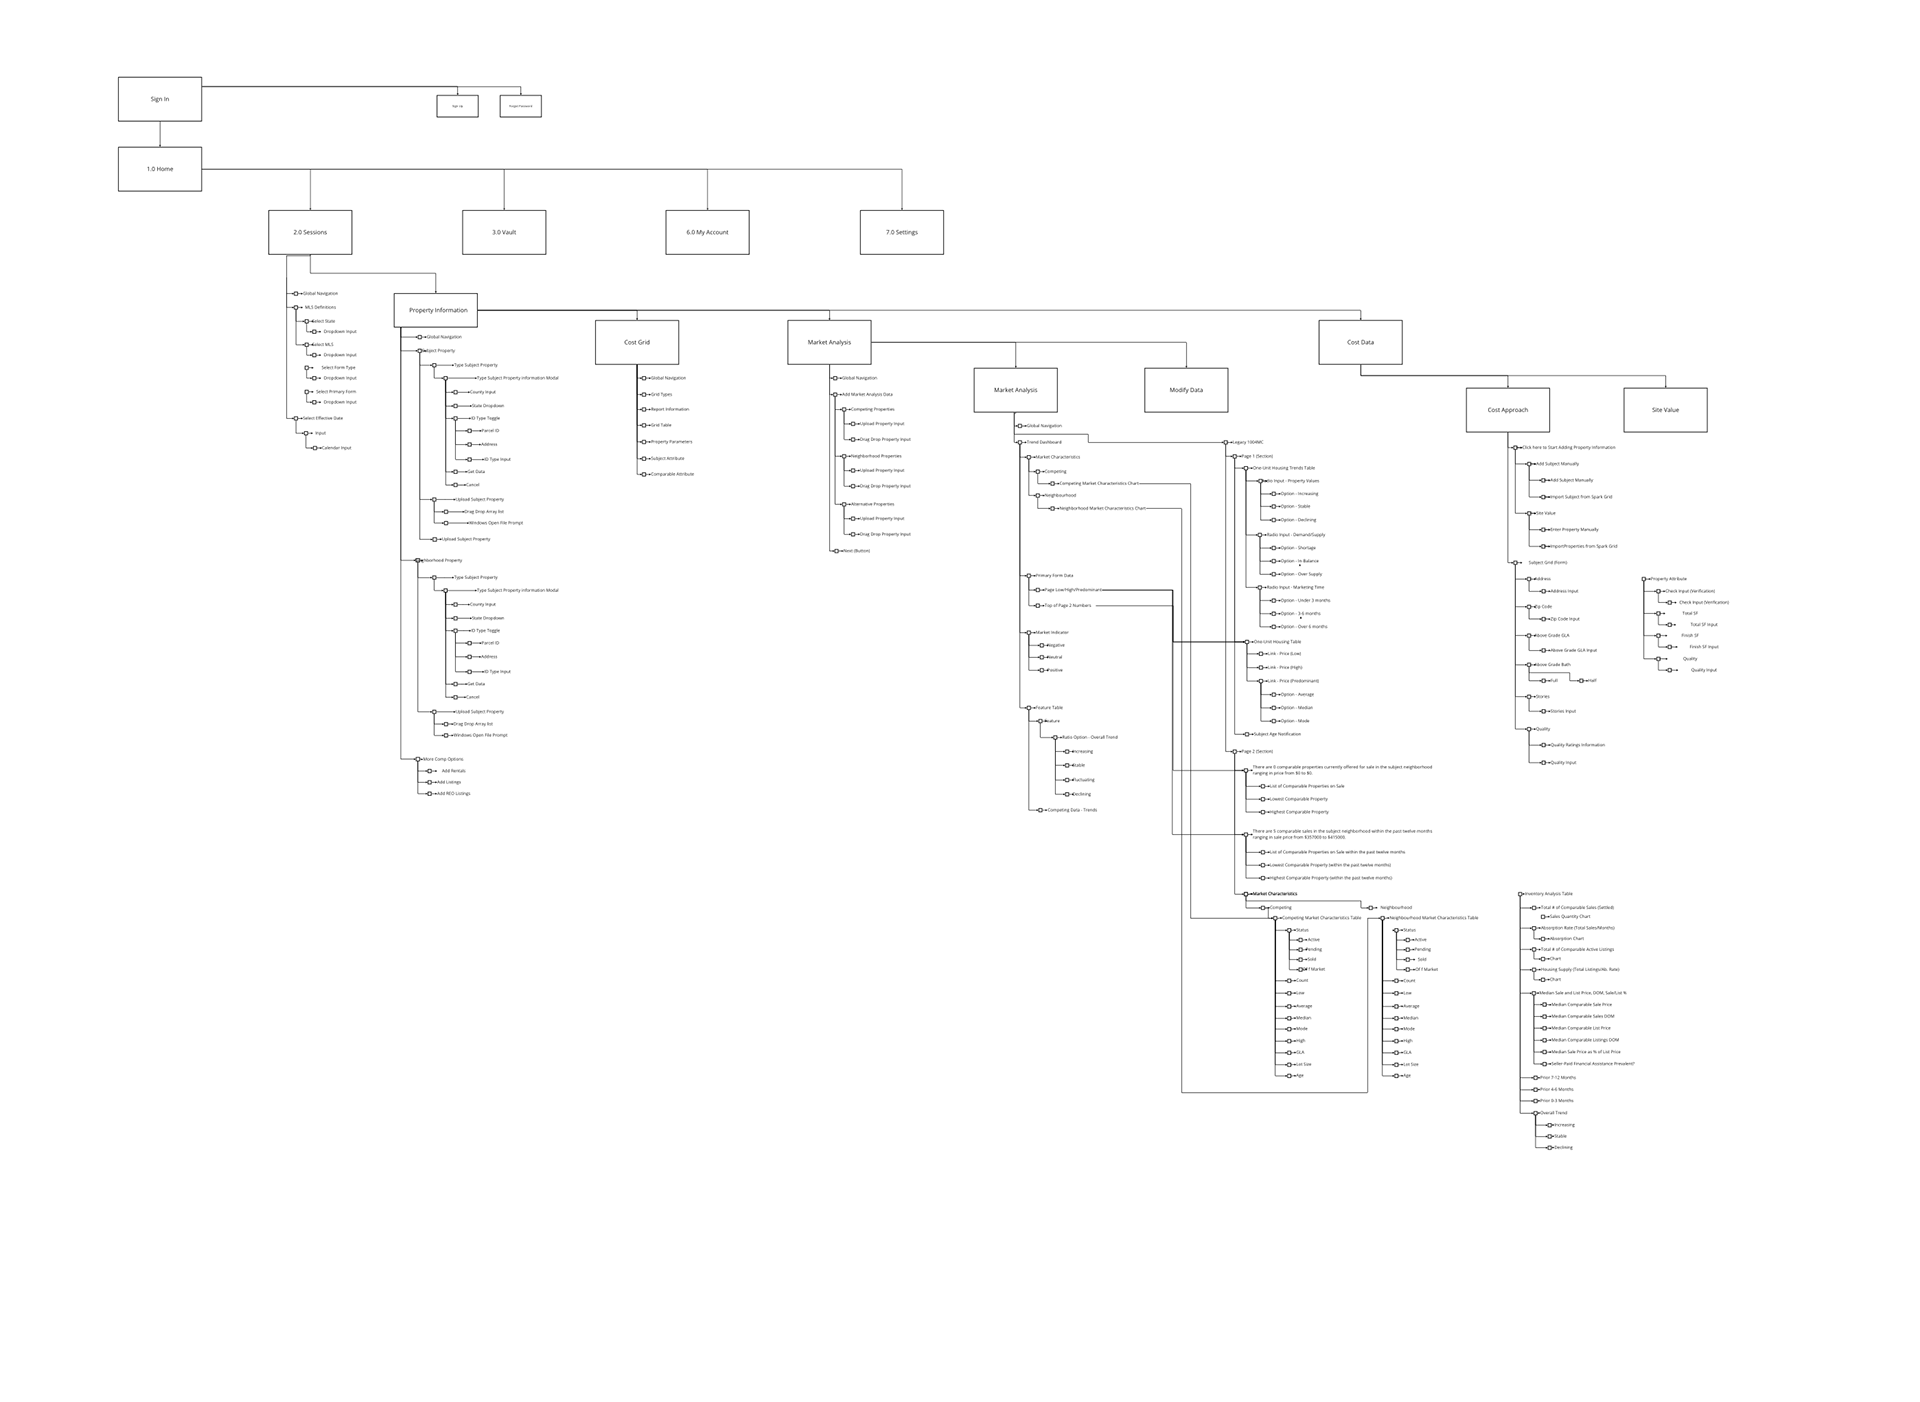
Full Function Map of the current Nova SaaS.
Function Map
From these maps, the app was restructured into a clearer, user‑driven IA for Nova. Instead of the previous focus being on allowing customization, instead user intention is taken as the focus. Each goal leads to a screen. Any ambiguities can also surface, with the placement of sticky notes. This allows us to address the client's intentions with their userbase.
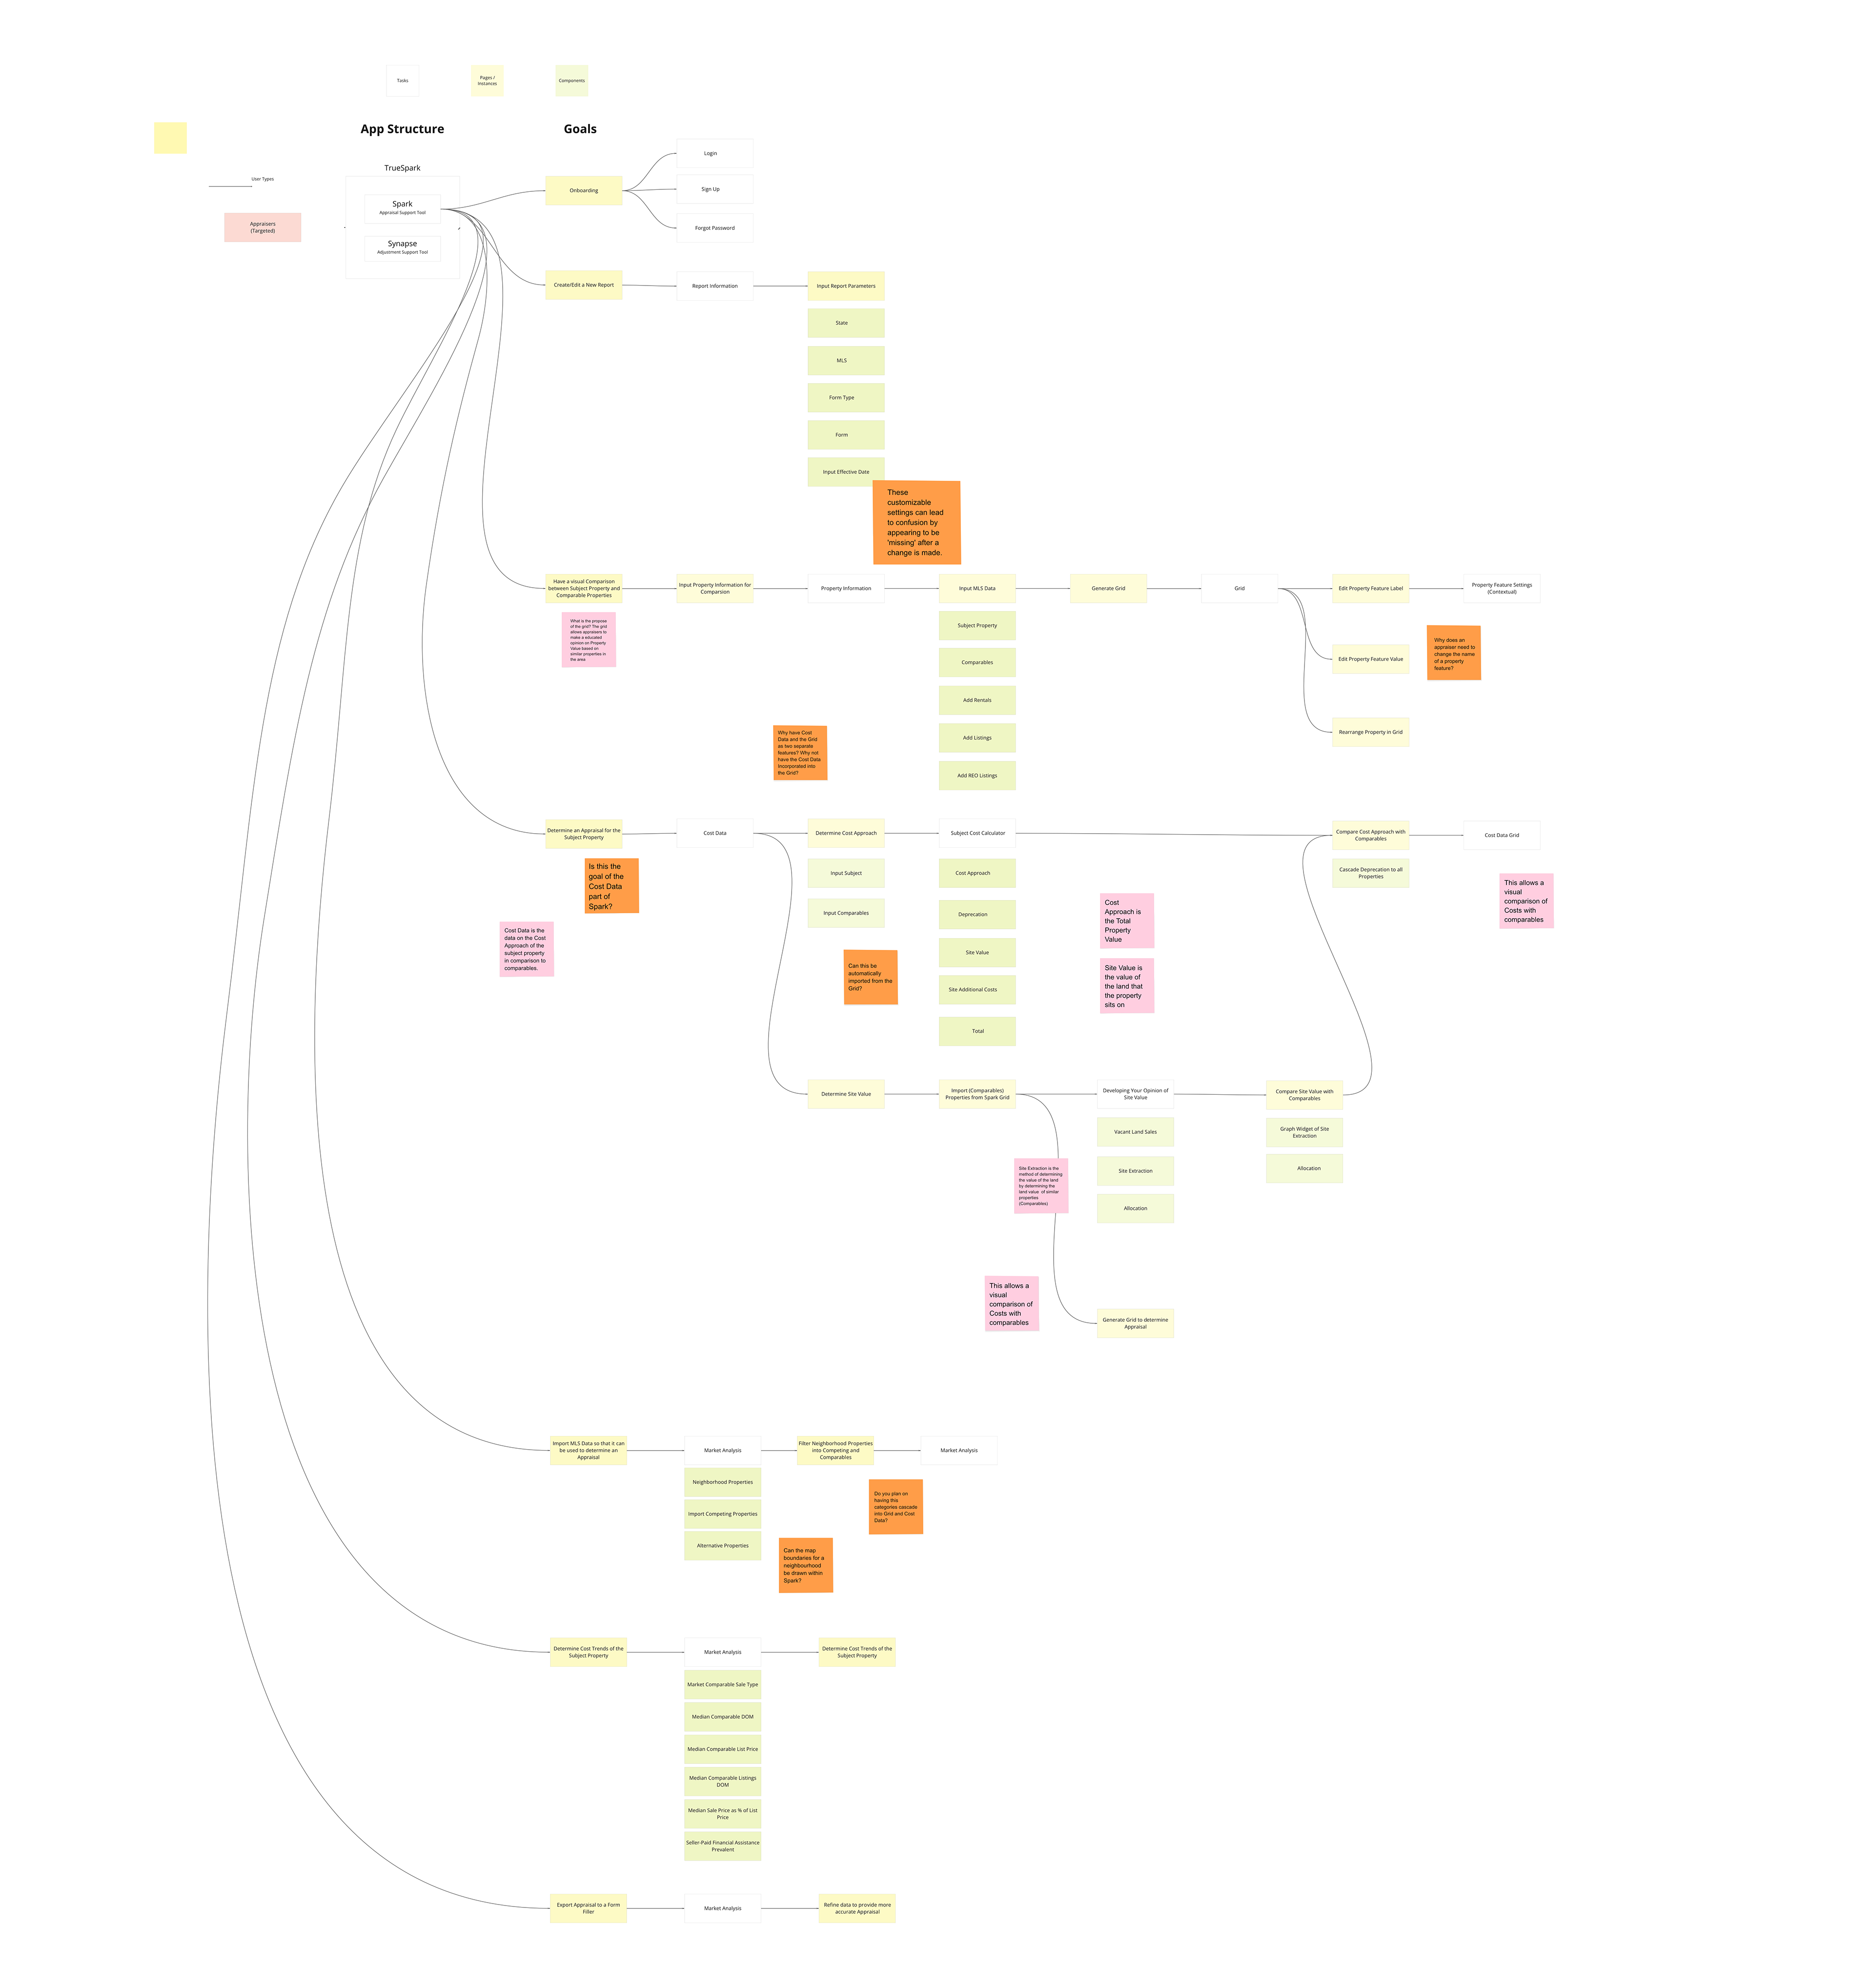
Nova Intention Sitemap, organizing the app into a single flow based on user intention: Home → Session → Get Data (Upload) → Market Trends → Grid → Adjustments → Cost Approach → Export.
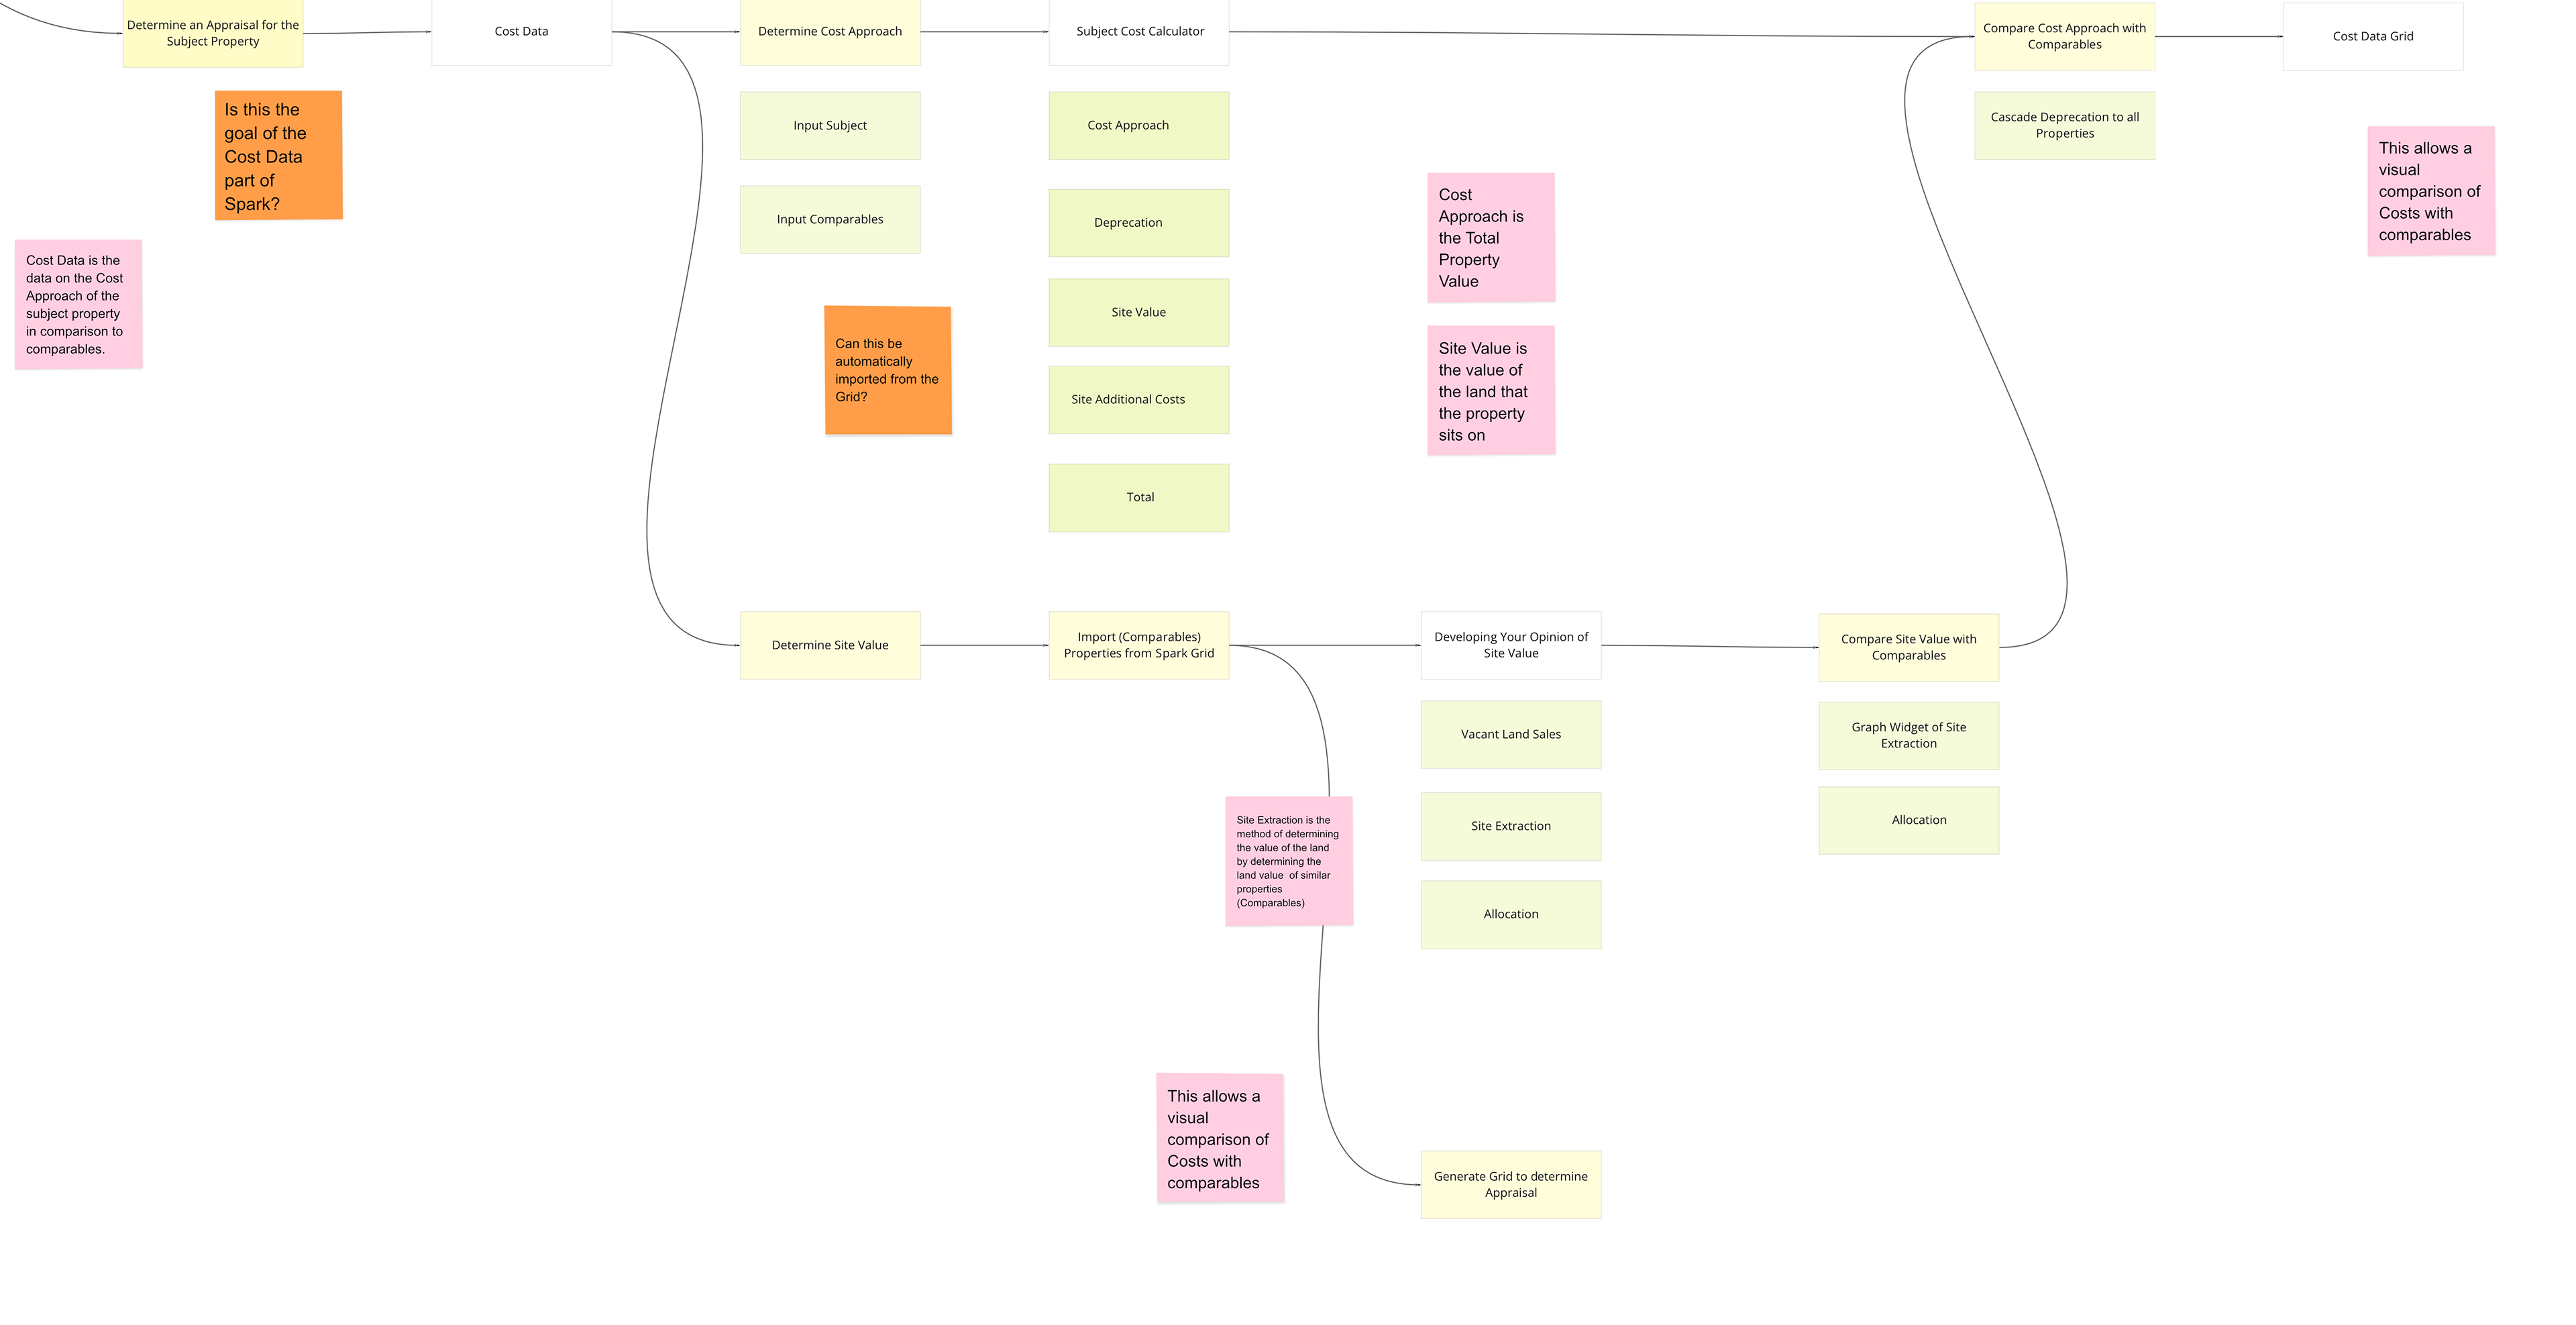
Nova Intention Sitemap - Snippet. Top: For comparisons between individual comps, the user would go to Property Information to upload this data first, particularly for the subject property. Bottom: Based on the features of the subject properties and its comps, the true appraised value can the calculated in another screen called Cost Data.
Process – from flows to UI
User Story Flows
With an understanding of the functionality of the current app, and user needs, we made an exhaustive list of user stories. For major stories, flows illustrate how a user can navigate effectively.
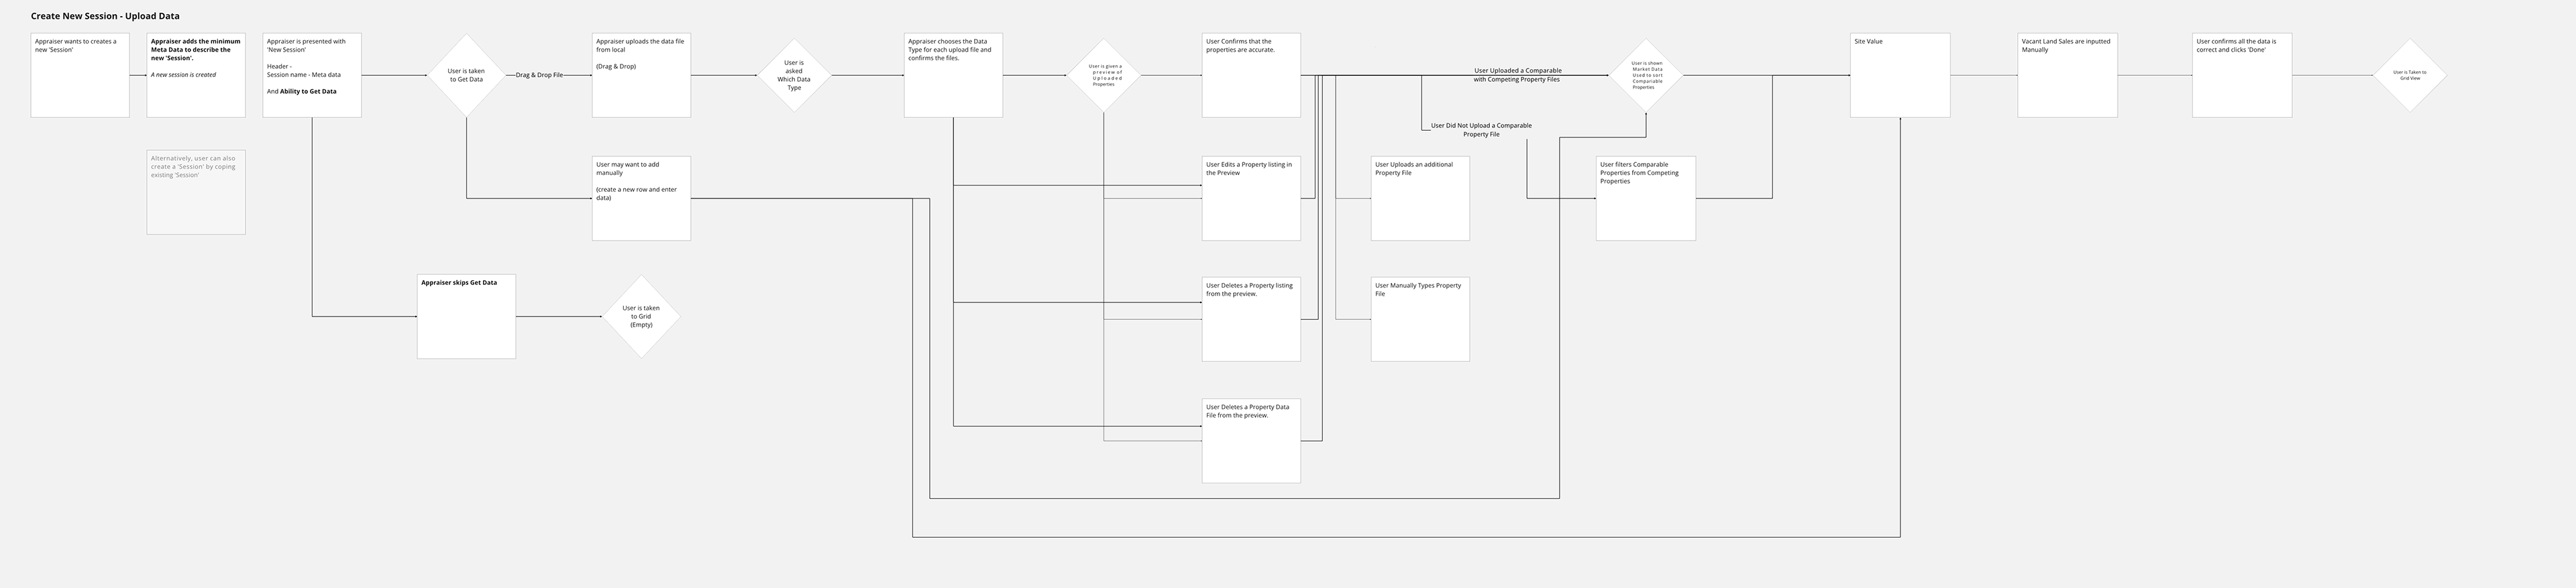
User story flow of creating a new session (a document) and uploading capturing each action an appraiser takes—from creating sessions and uploading data to confirming comps and exporting reports.
Information Architecture
Connecting user stories together, a 'proto-wireframe' of the new app can be built which creates a high level of the new application's backbone.
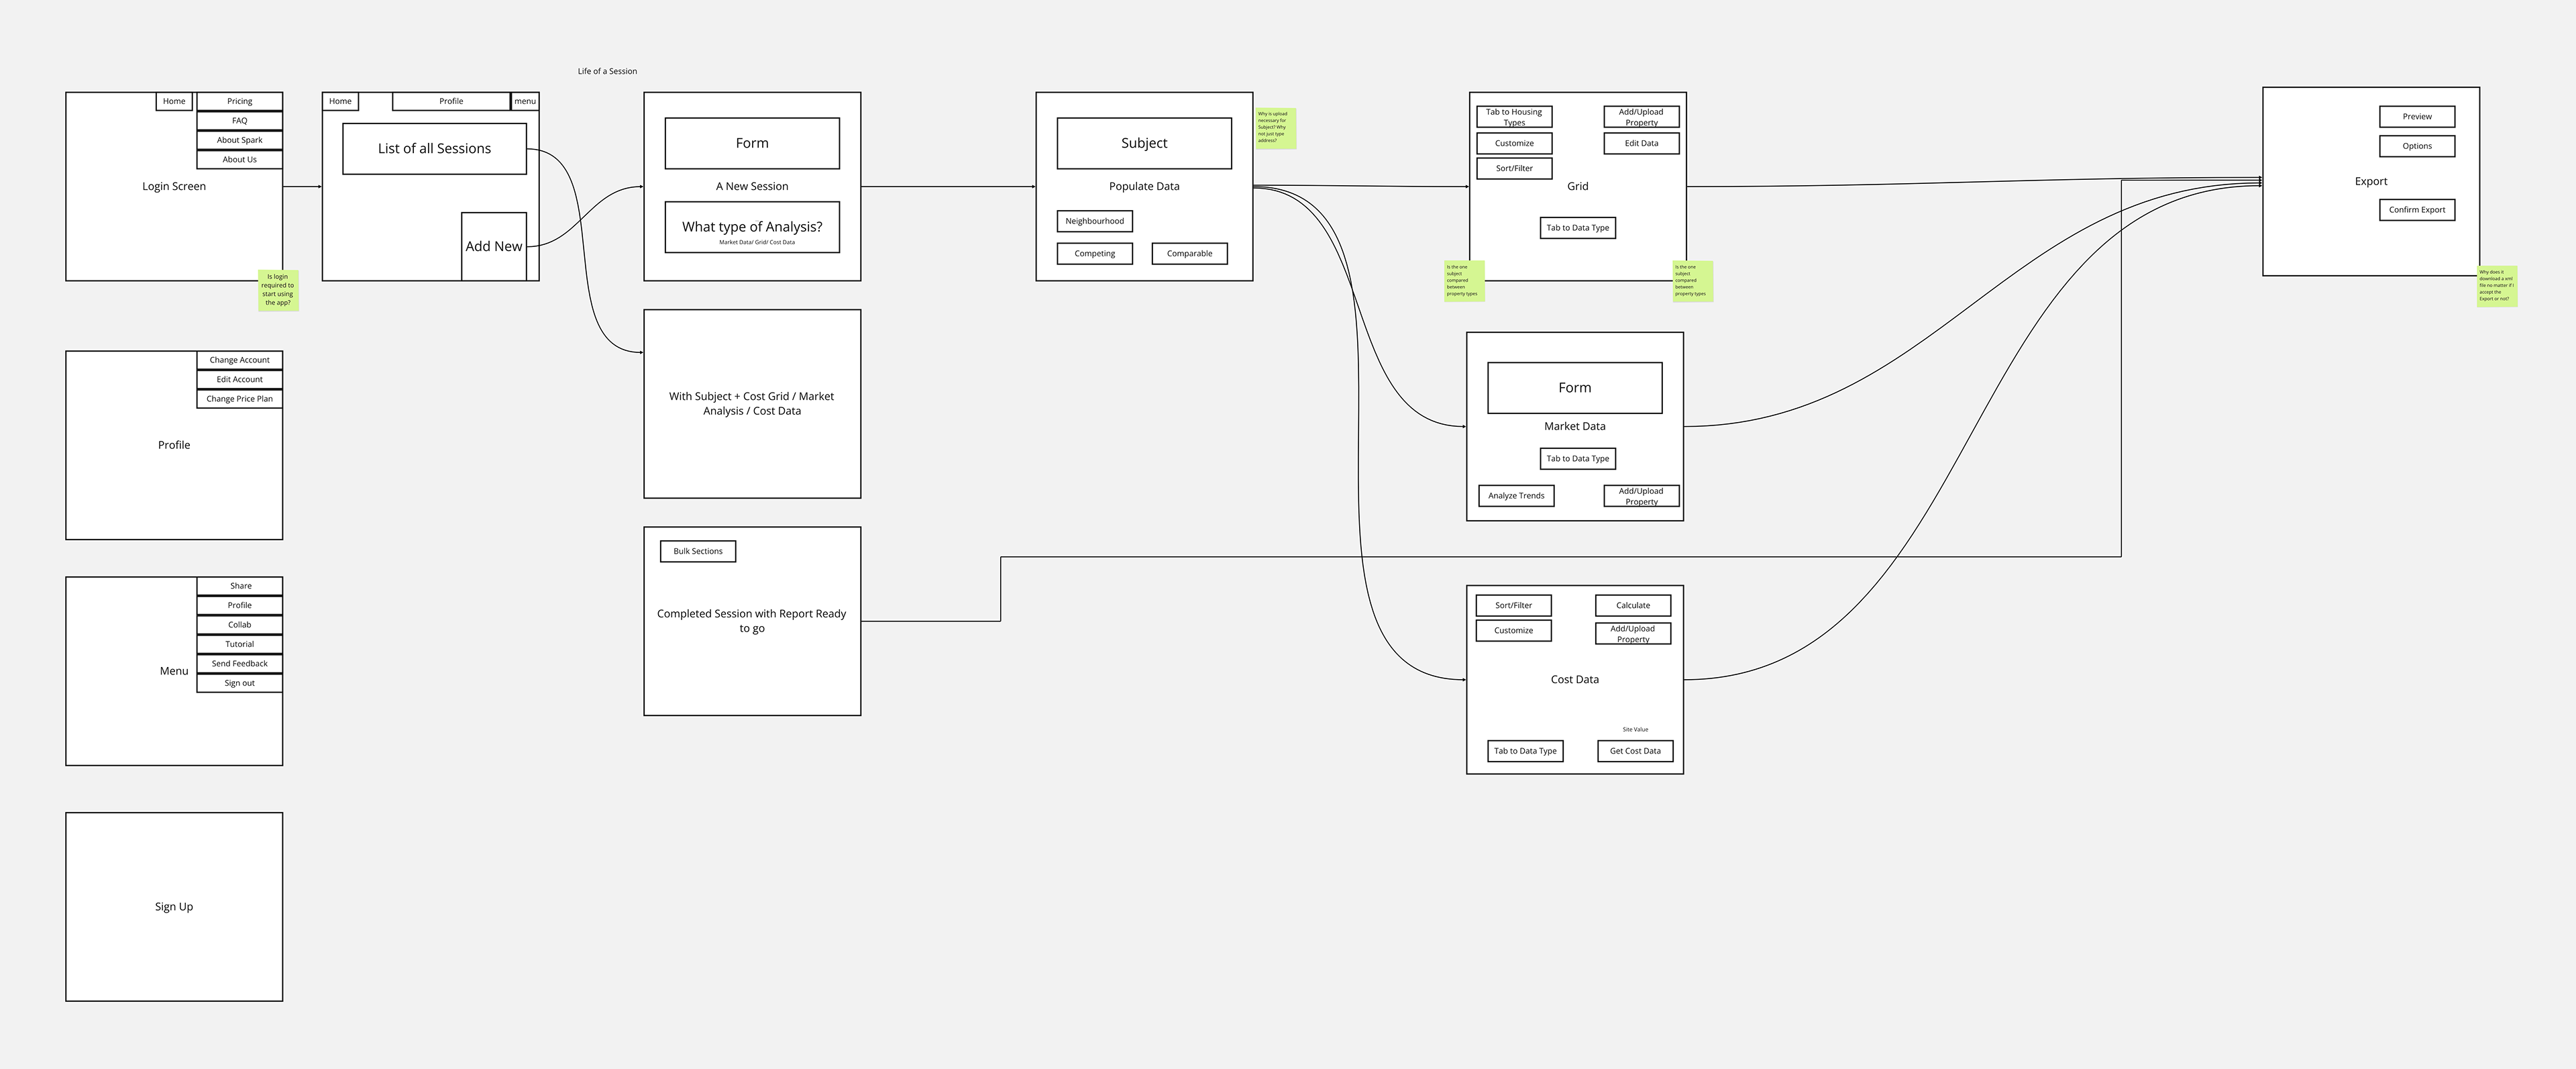
Information architecture for the revamped app, mapping user stories into a coherent navigation and page structure.
Page User Flow
Then for each page, needs and functions are drawn as flows in granular fashion. This builds out what and how functions, modals, etc. would be used for the redesign.
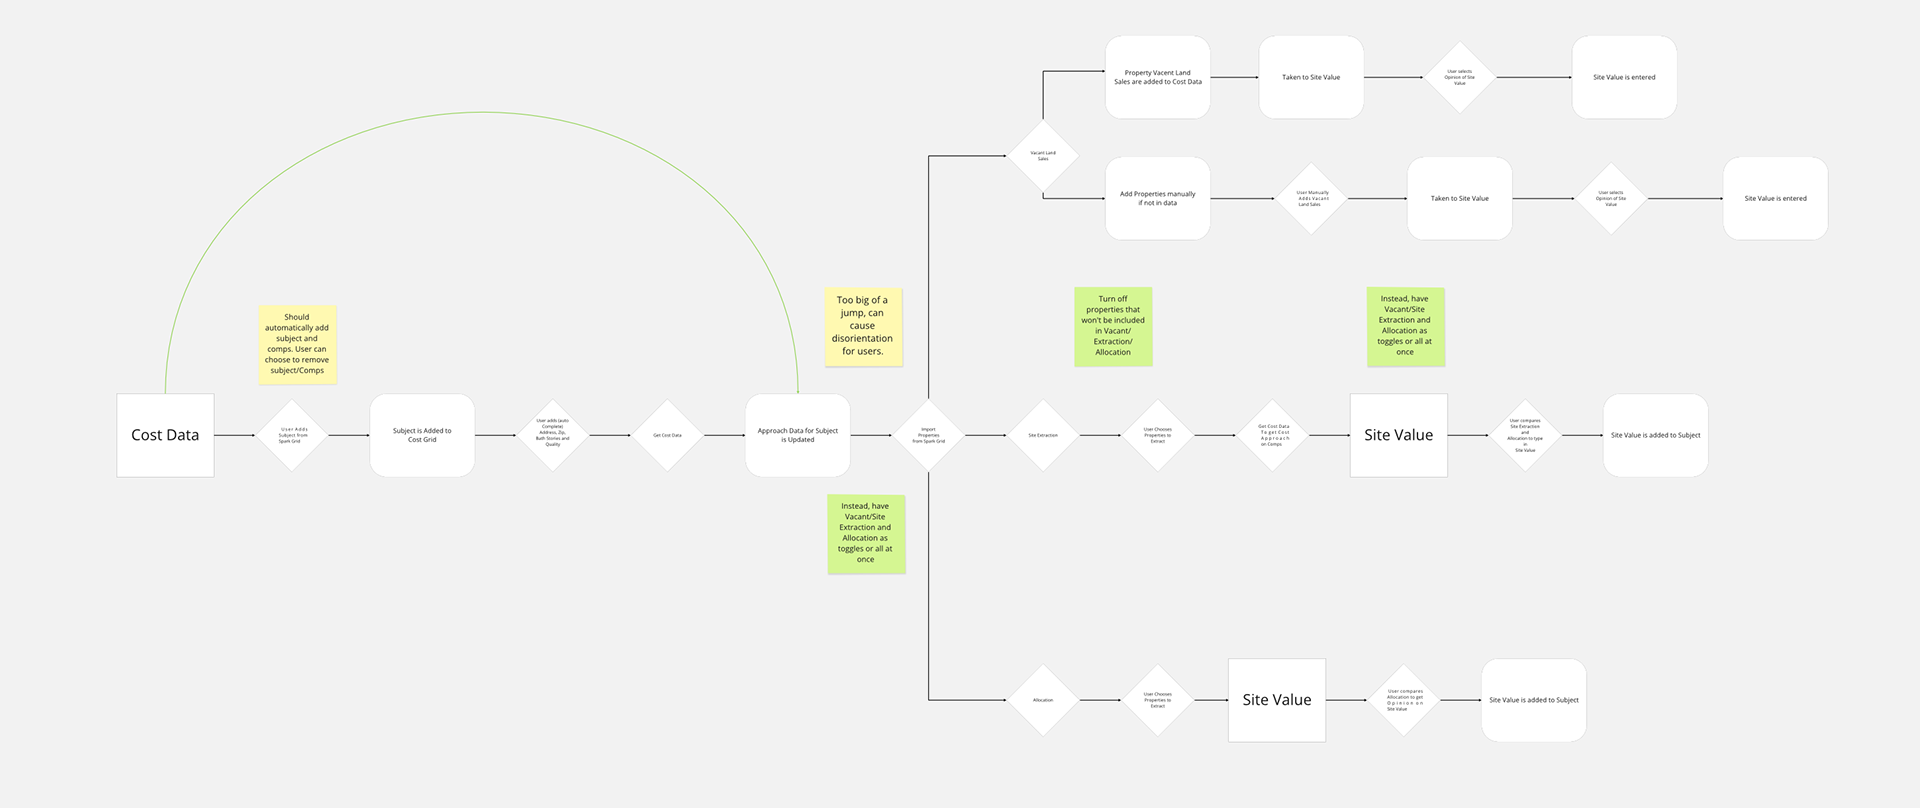
Page-level user flow showing how appraisers move through Nova from starting a session to exporting a report.
Wireframing
Lastly, wireframes are made to define structured functions.
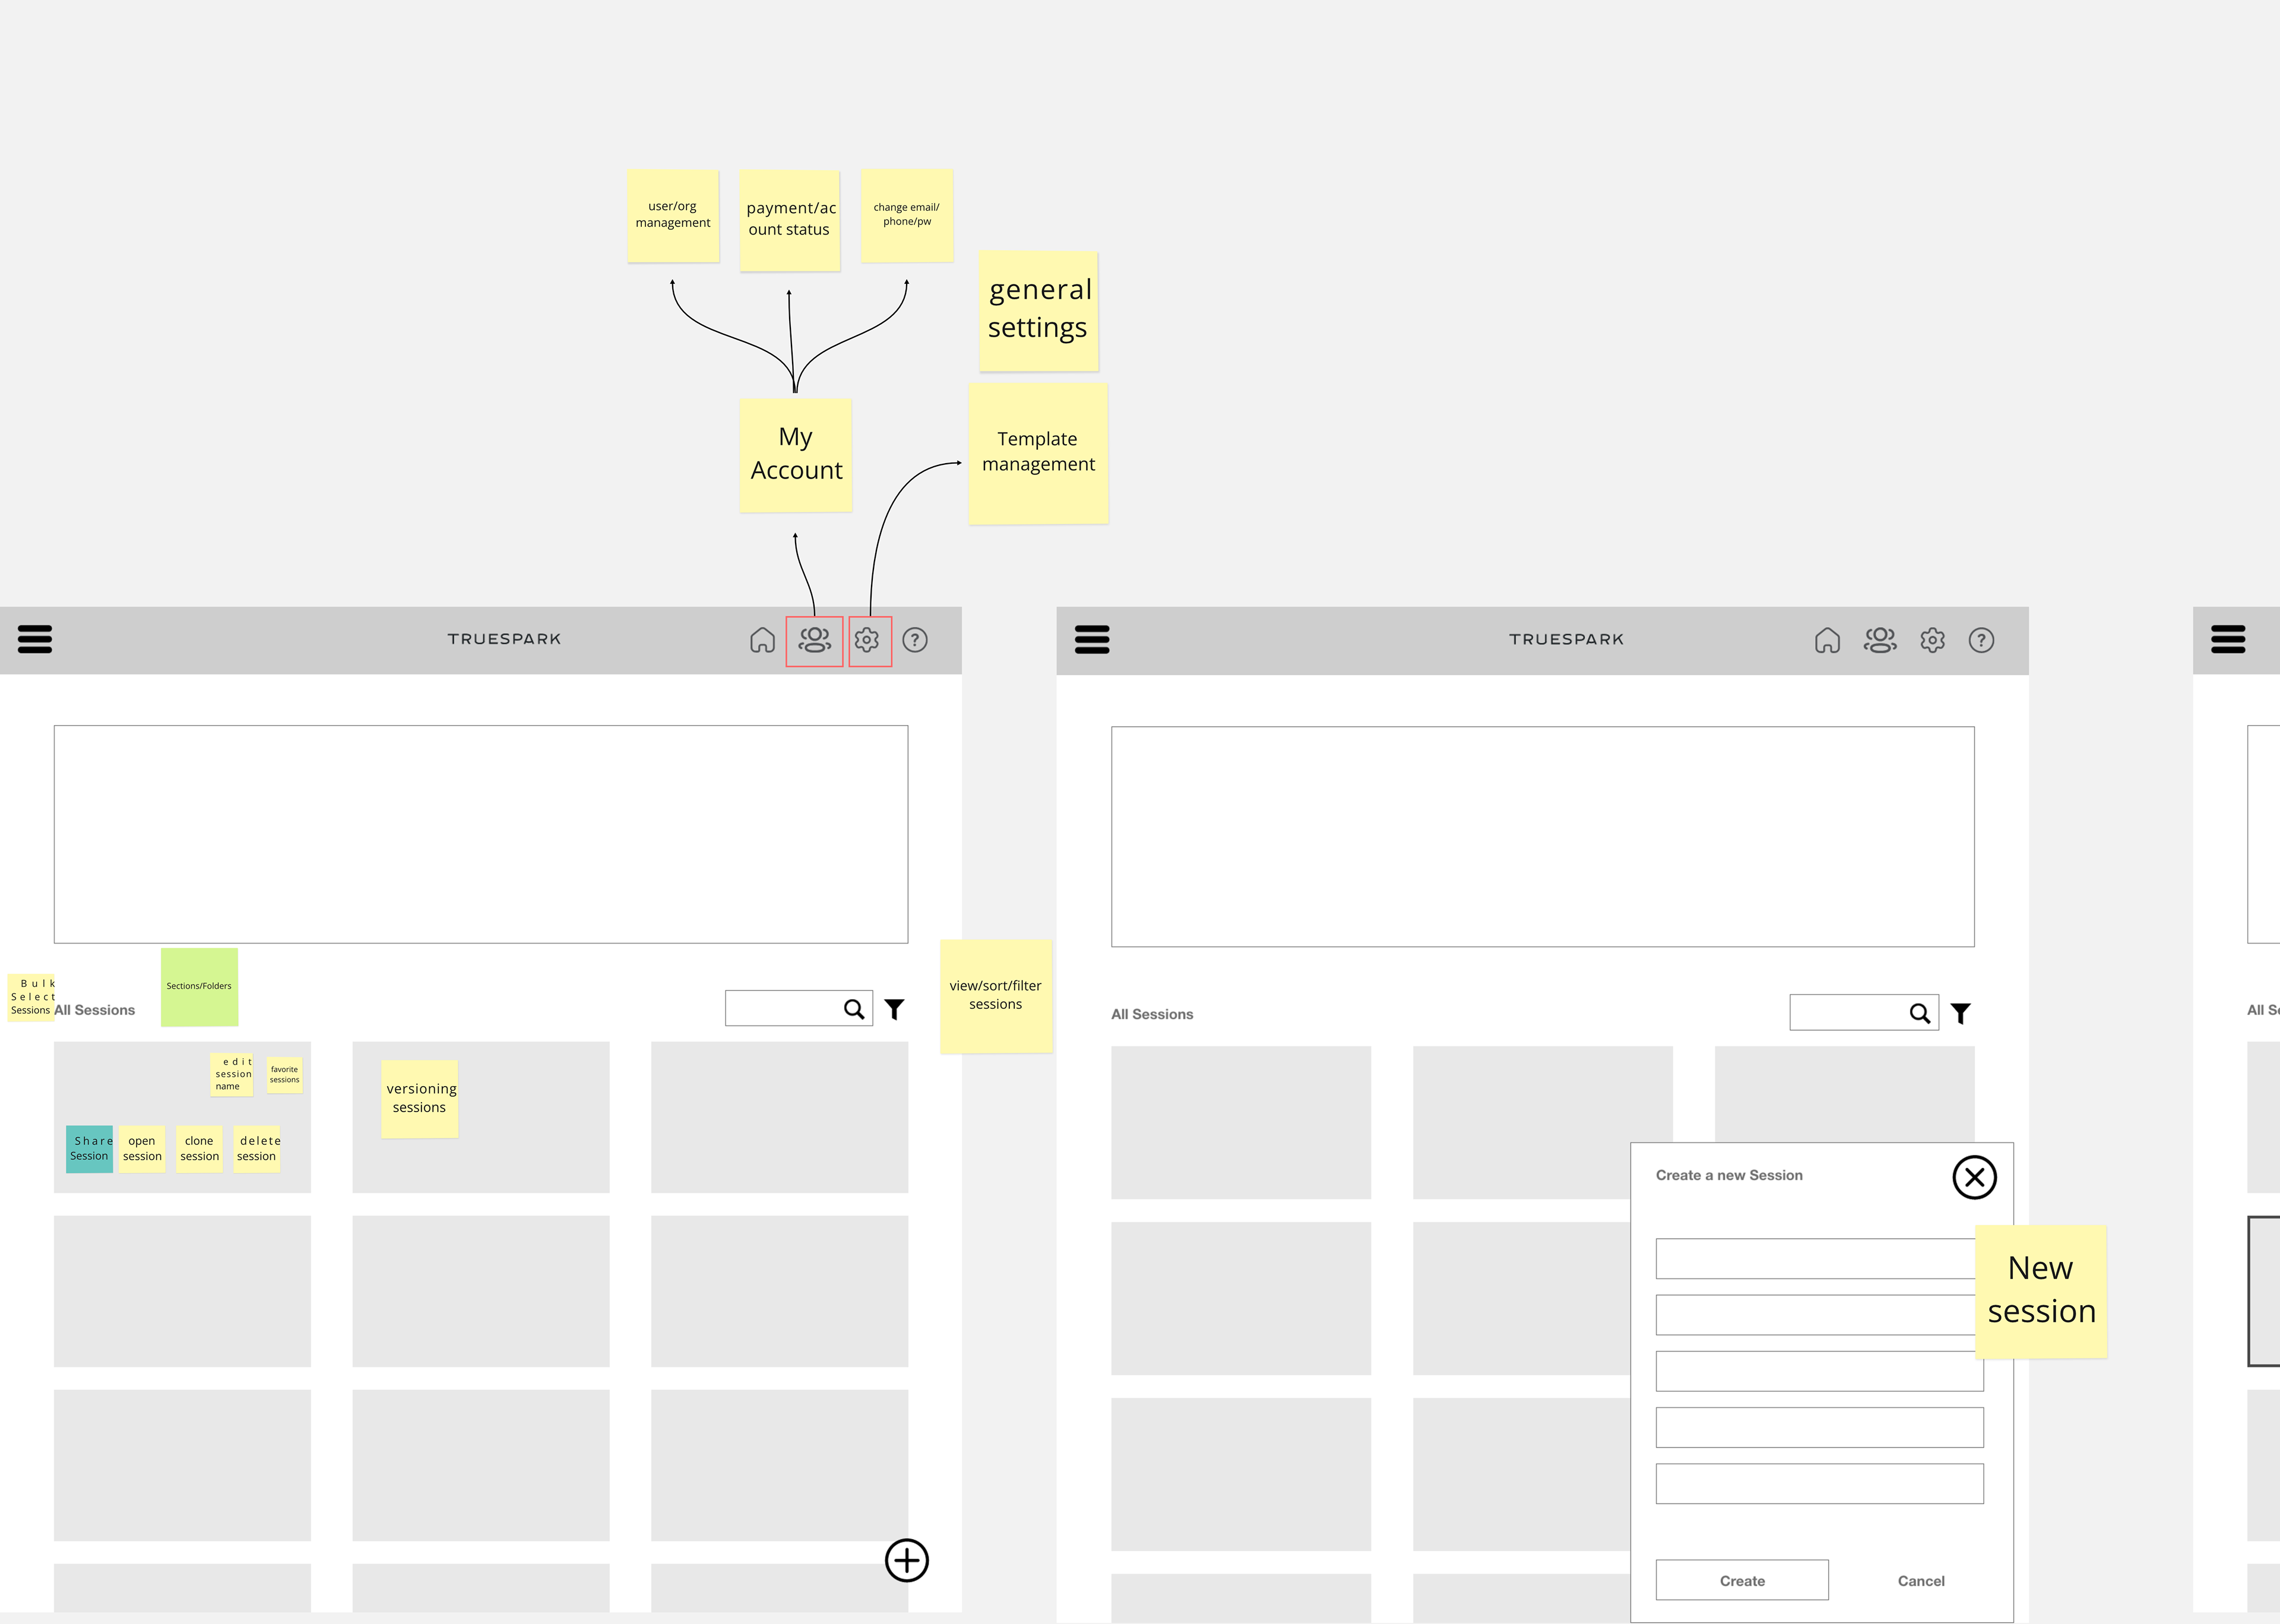
Early wireframes translating flows and IA into concrete layouts for sessions, Market Trends, and the comparable grid.
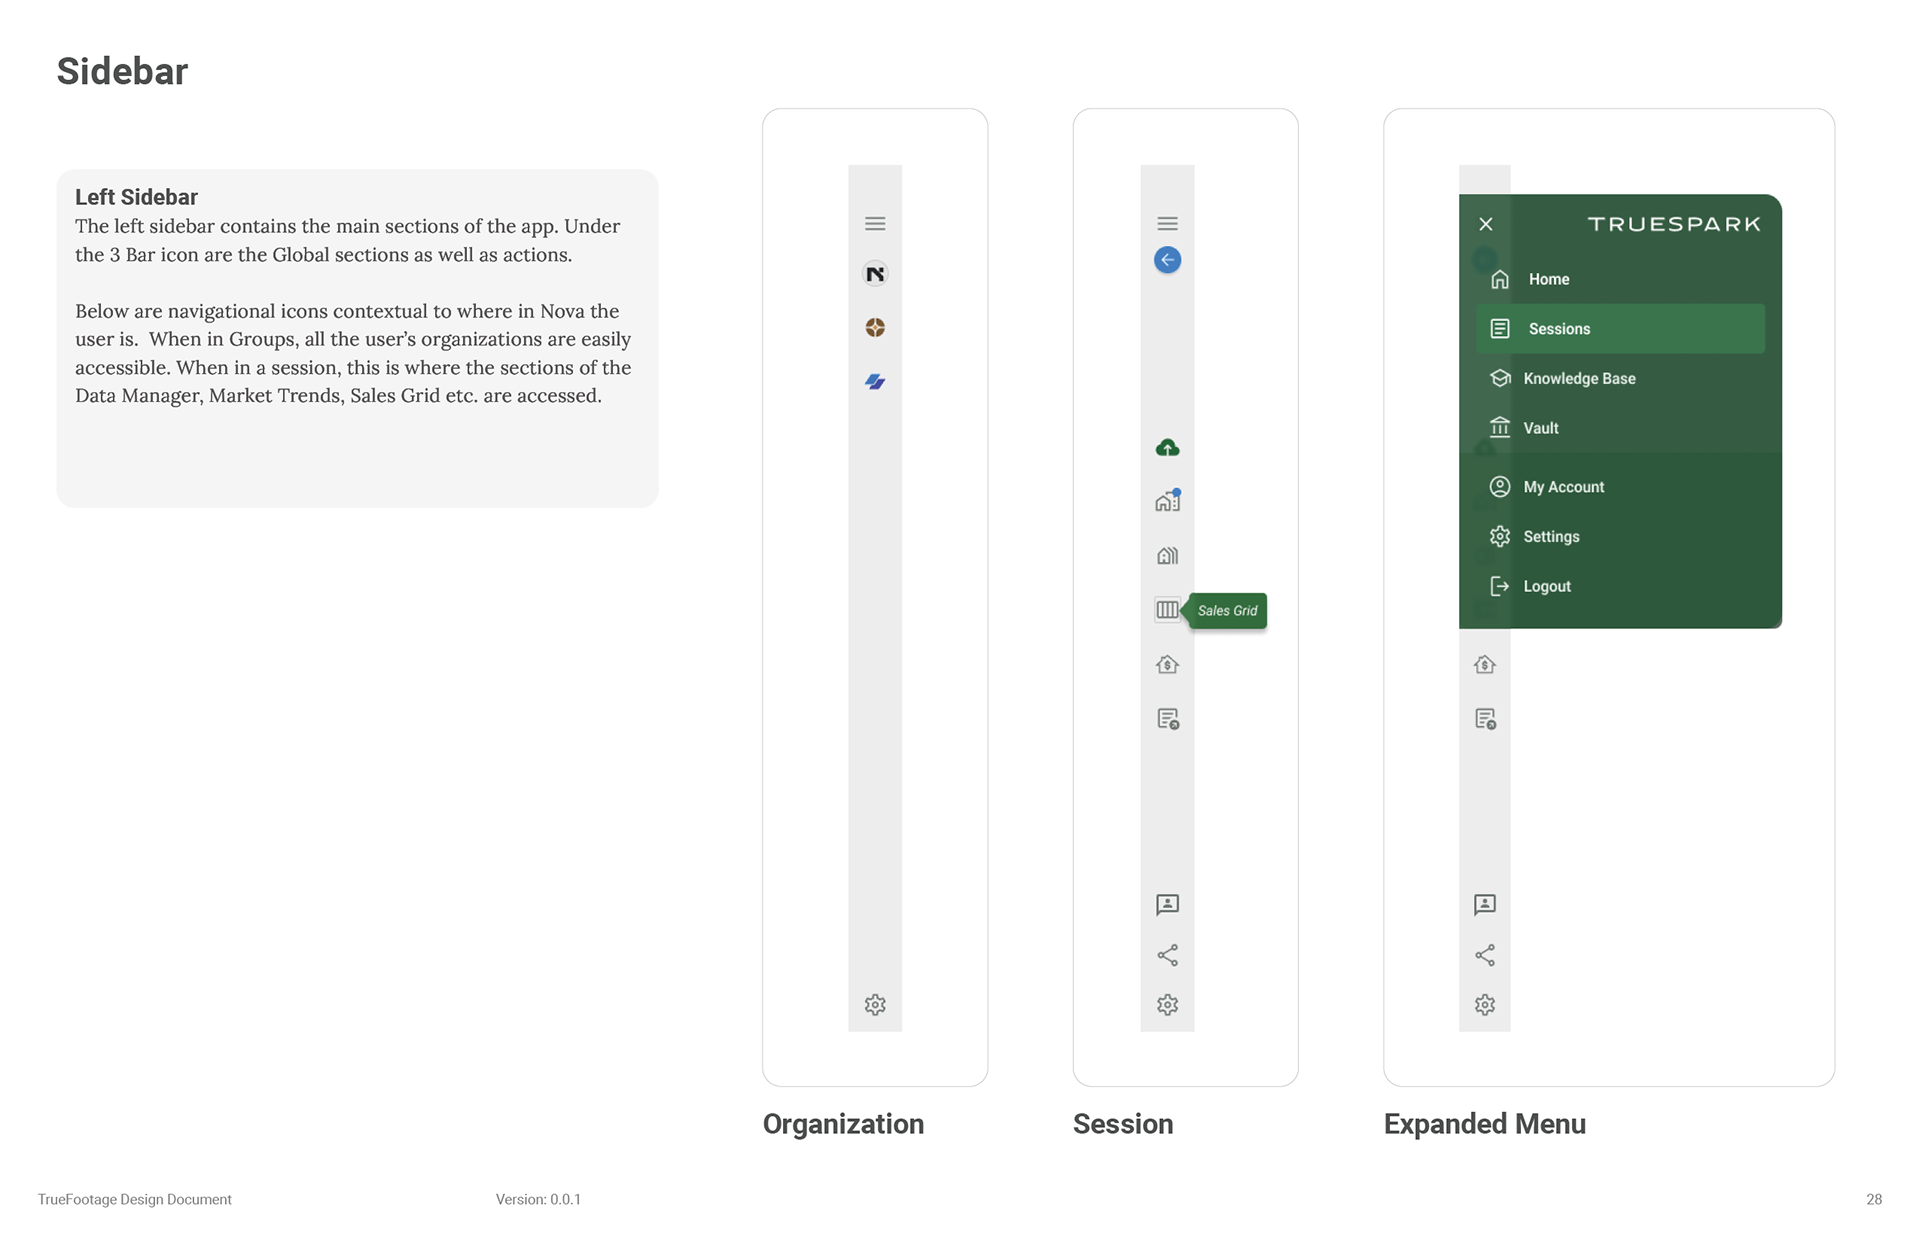
The Sidebar which acts as the navigation throughout the entire experience.